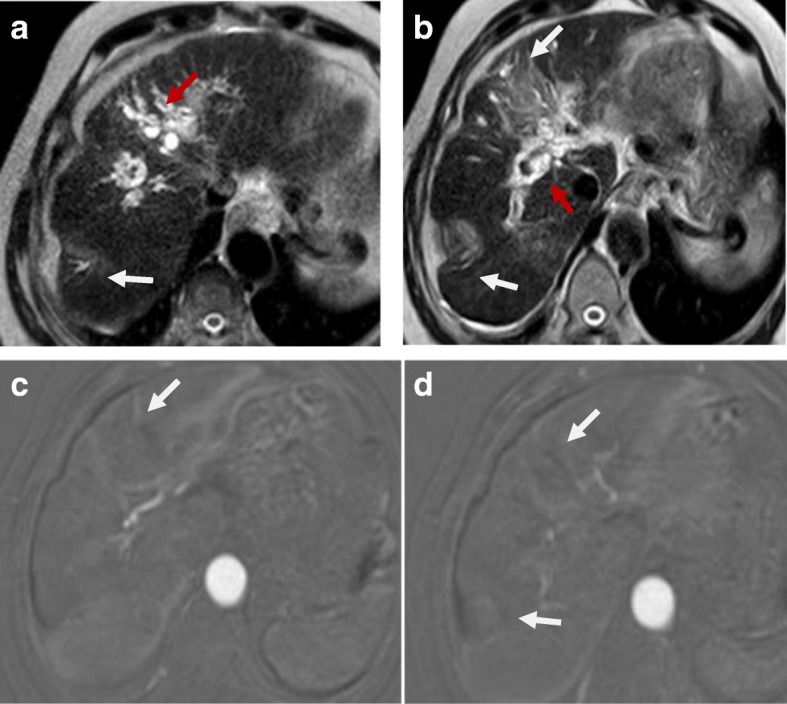
Fig. 8.

Hepatic focal lesions after TACE. a, b T2-WI shows two well-defined HFLs of an intermediate to high signal (white arrows) with central biliary dilatation (red arrow). c, d Subtracted T1-WI arterial phase shows no enhancement of the lesions. Overall post-treatment assessment is LR-TR nonviable with post-therapy biliary dilatation
