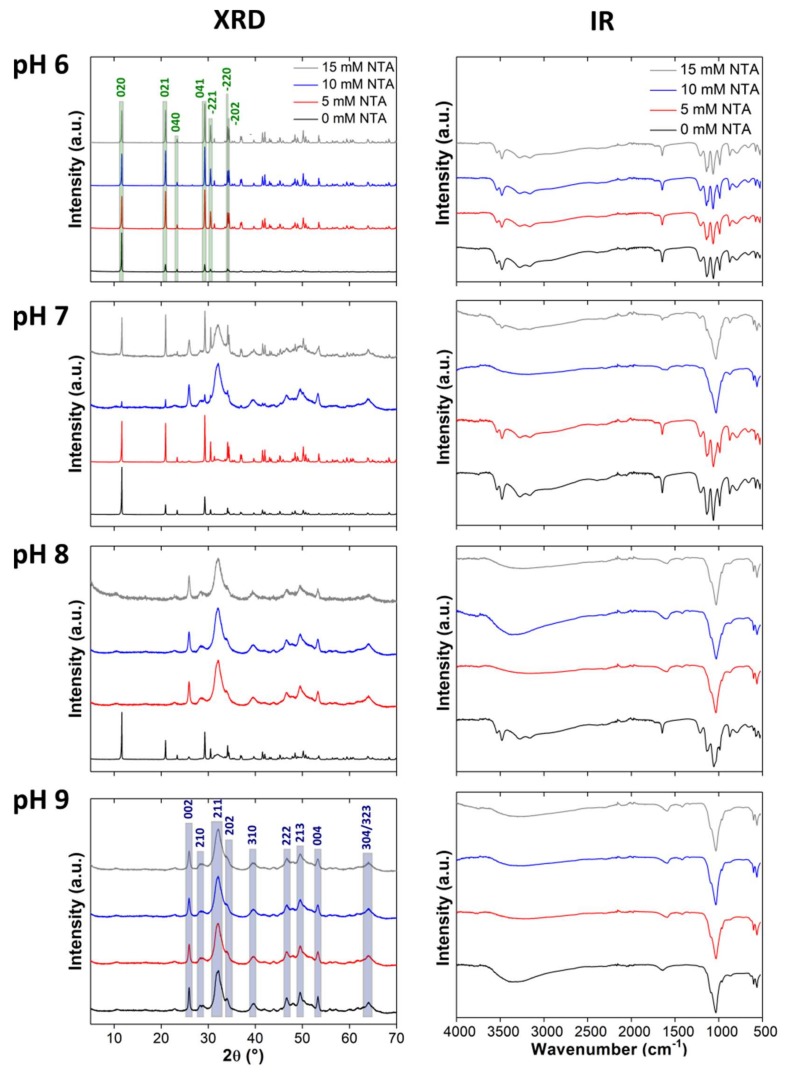
Figure 2.
X-ray diffraction (XRD) patterns and infrared (IR) spectra of samples mineralized at different NTA concentrations (0, 5, 10, 15 mM) and pH (6–9). The different intensities in the patterns of the control samples are likely due to sample orientation effects. Highlights indicate dicalcium phosphate dihydrate (DCPD; green) and hydroxyapatite (HAP; blue) signals, respectively. These apply to all images in the manuscript; only the most important reflections are highlighted. a.u.: Arbitrary units.

