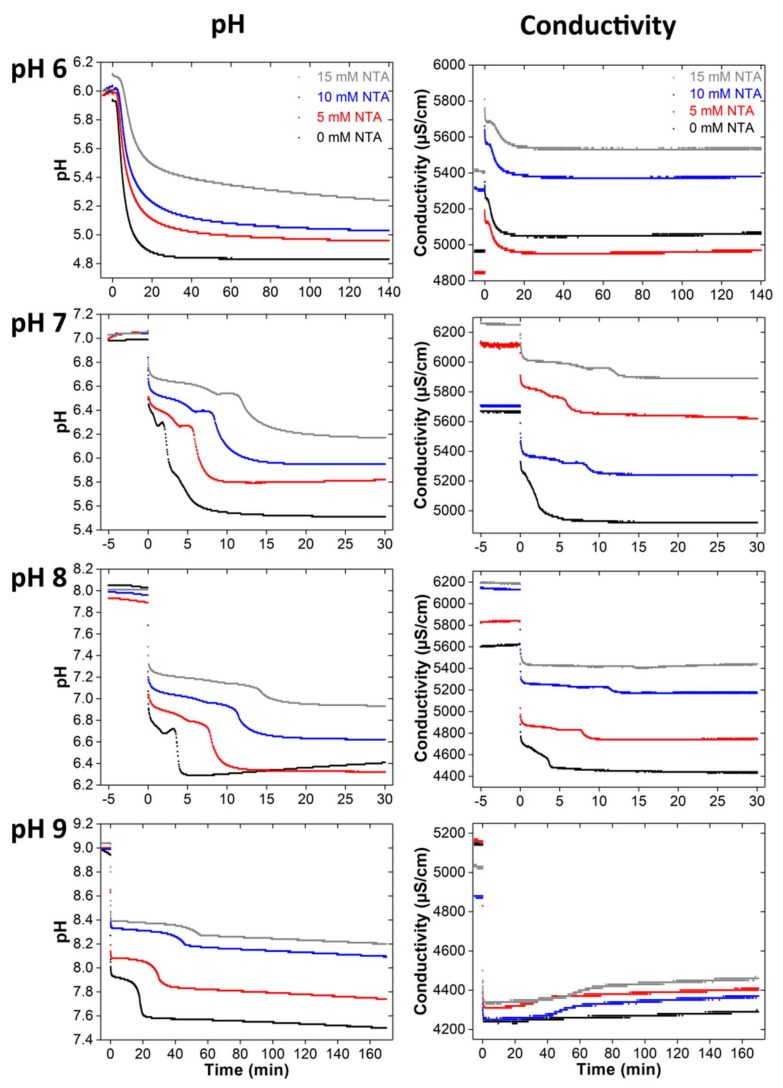
Figure 3.
pH and conductivity data obtained from in situ measurements during mineralization with different NTA concentrations and starting pH. Note that the mineralization times are different: the end points (points after which no more changes in the data are observed) of the individual series of measurements were determined from longer measurements (data not shown). At the beginning of each measurement, the pH of the initial solution (40 mM calcium nitrate solution with 0, 5, 10, and 15 mM of NTA) was stirred and the pH and conductivity were recorded for 5 min. Then a 40 mM diammonium hydrogen phosphate solution was added and the mineralization experiment was started. This point is the “0” on the time axis.

