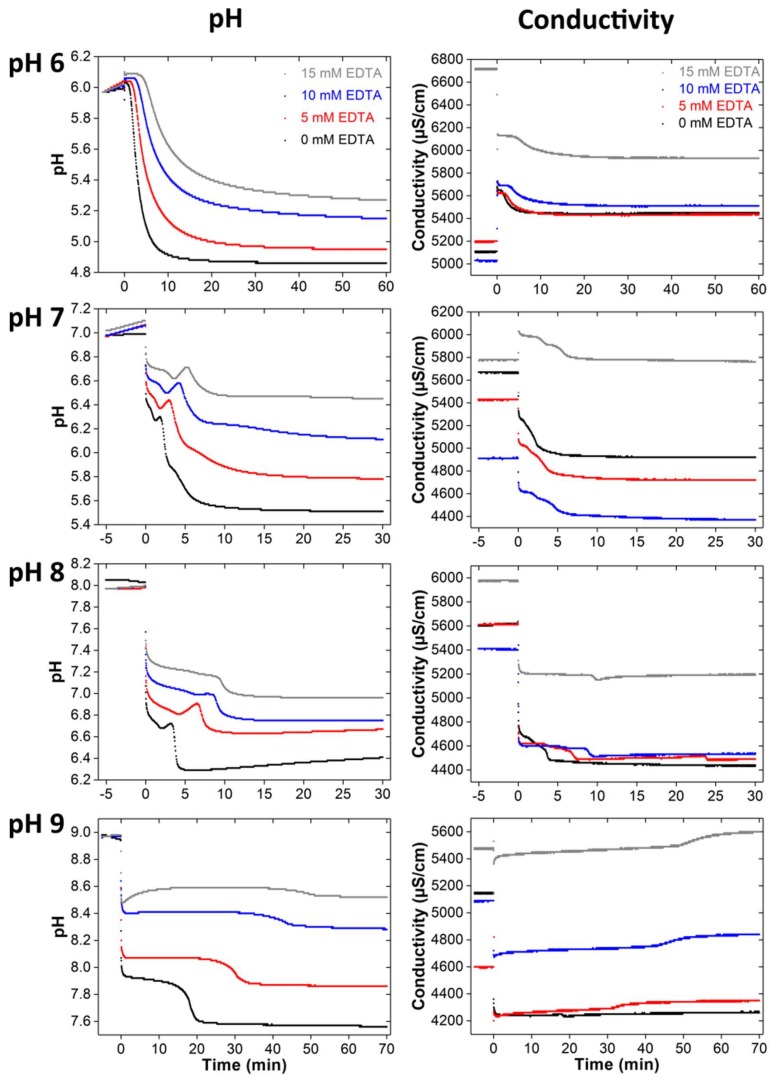
Figure 6.
pH and conductivity curves of samples mineralized at different EDTA concentrations (0, 5, 10 and 15 mM) and starting pH (6–9). Note that the mineralization times are different. Long time measurements have shown that the values do not change anymore after the reaction times shown here; the corresponding data are therefore not shown.

