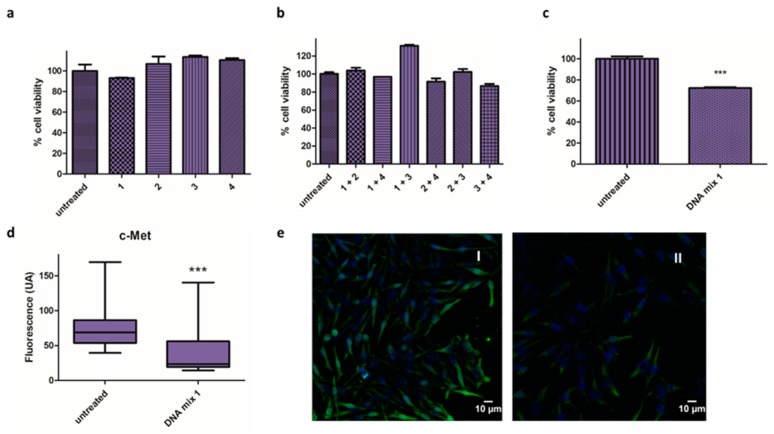
Figure 1.
Activity of microRNA mimics. (a–c) Cell viability assay in Mel 202 cells using different combination of oligonucleotides 1, 2, 3 and 4: (a) Mel 202 cells were transfected with individuals oligonucleotides (1, 2, 3 and 4) treatment at 140 nM/well; (b) Mel 202 cells were transfected with oligonucleotides in pairs (final oligonucleotide concentration of 140 nM); (c) Mel 202 cells were transfected with DNA mix 1 at 140 nM (*** p < 0.001). (d,e) Immunofluorescence analysis in Mel 202 cells: (d) Fluorescence intensity (arbitrary units, AU) of c-Met in untreated cells and treated with the DNA mix 1 (*** p < 0.001); (e) Representative immunofluorescence images of cells untreated (I) and treated with the DNA mix 1 (II). c-Met is shown in green and nucleus are labeled in blue by Hoechst staining. Statistical analysis was performed using one-way ANOVA (each group vs. control).

