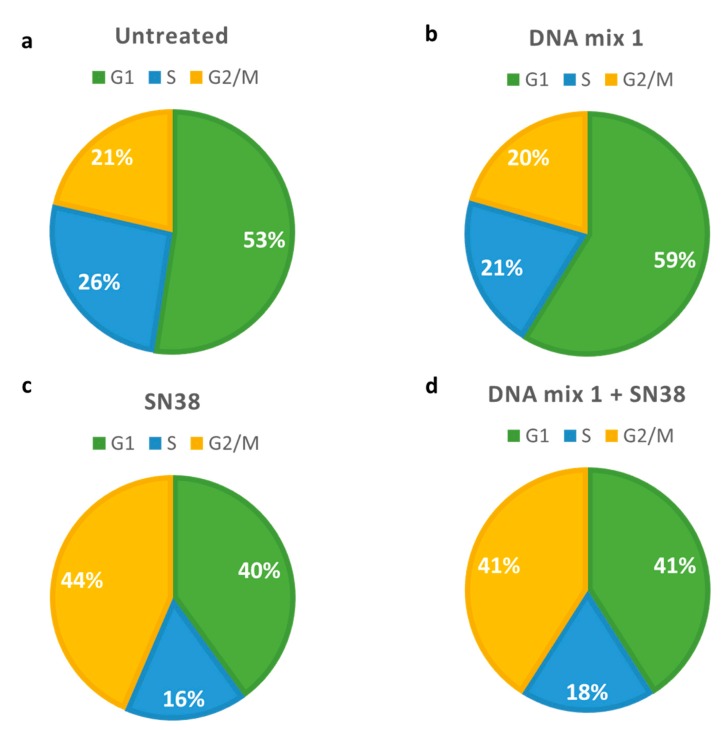
Figure 3.
Pie charts describing flow cytometry data in Mel 202 cells. (a) Untreated cells; (b) Cells treated with 140 nM DNA mix 1; (c) Cells treated with 25 nM SN38; (d) Cells treated with 140 nM microRNA mimics and 25 nM SN38. Green: cells in G1 phase; blue: cells in S phase; yellow: cells in G2/M phase.

