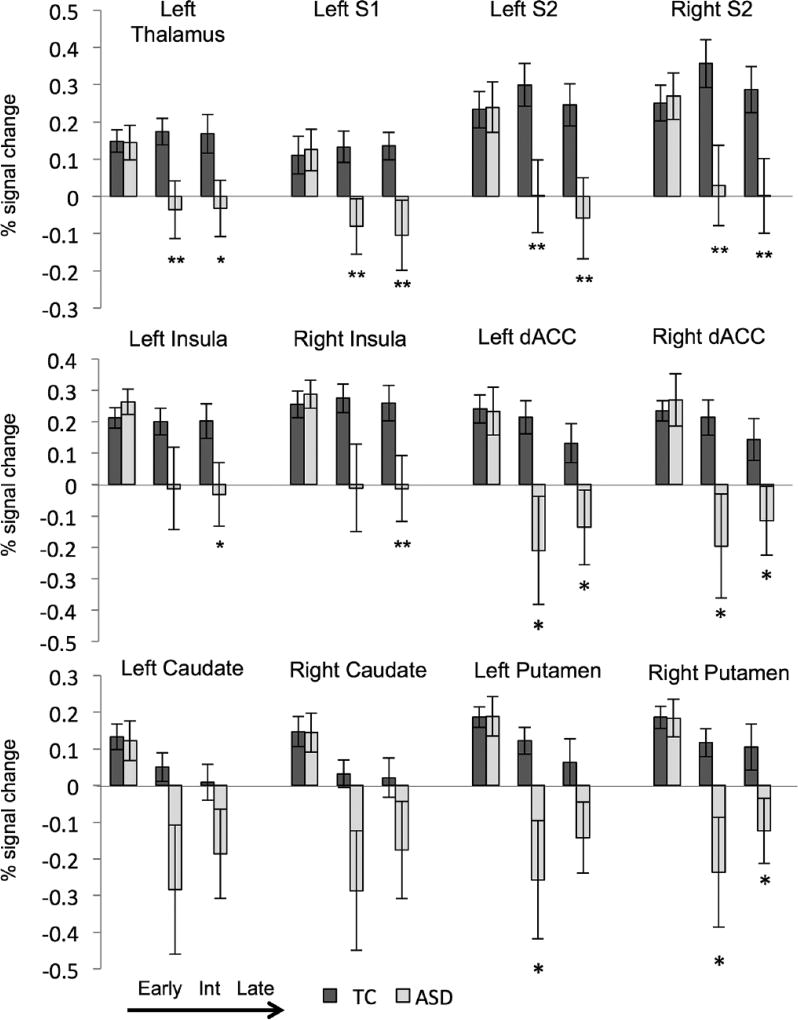
Figure 3.
Region of interest analysis: percent signal change in typical (TC, dark gray) and individuals with autism spectrum disorder (ASD, light gray) within targeted regions of interest during early, intermediate, and late phases of painful stimulus presentation.
S1: primary somatosensory cortex; S2: secondary somatosensory cortex; dACC: dorsal anterior cingulate cortex; Int: intermediate.
ASD compared to typical: **p < 0.01, *p < 0.05, #p < 0.10.

