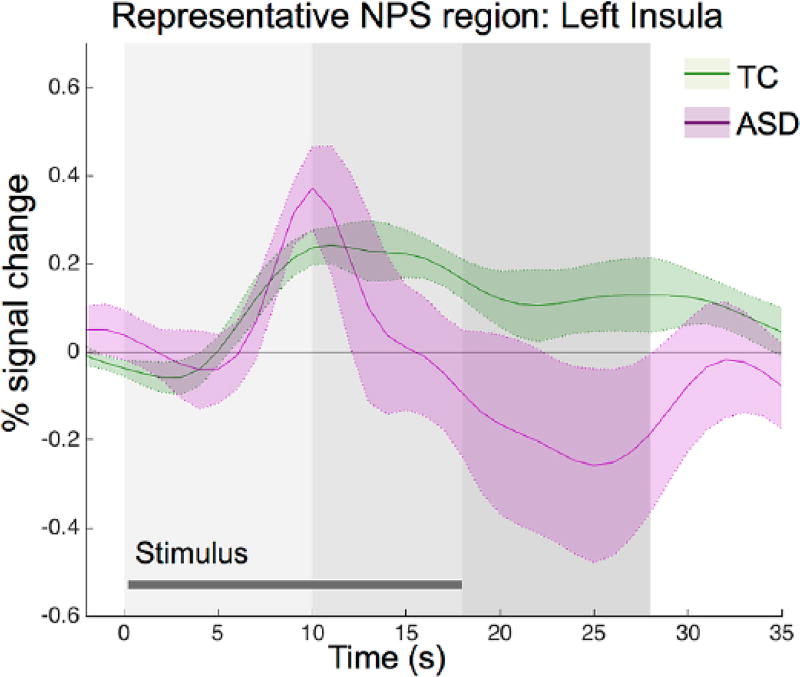
Figure 4.
Region of interest analysis: time course of the hemodynamic response within the typical comparison (TC) group and ASD group in a representative region from the neural pain signature (left insula). Similar response patterns exist across regions of the NPS. Gray shading indicates phase of pain stimulation (early, light to late, and dark).

