
FIGURE 2.
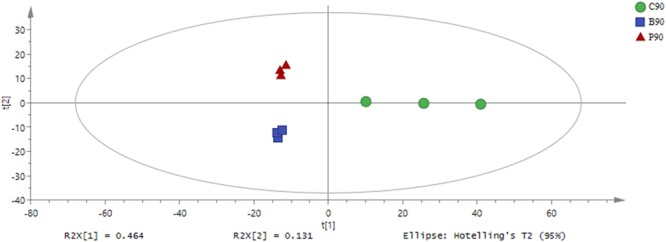
Partial least squares-discriminate analysis (PLS-DA) of metabolic profiles in whole crop corn silage inoculated without (green circle) or with L. plantarum (red triangle) or L. buchneri (blue square) (n = 3). Input data were the total mass of the signal integration area of each sample, and the signal integration area was normalized with method of internal standard normalization for each sample.