FIGURE 6.

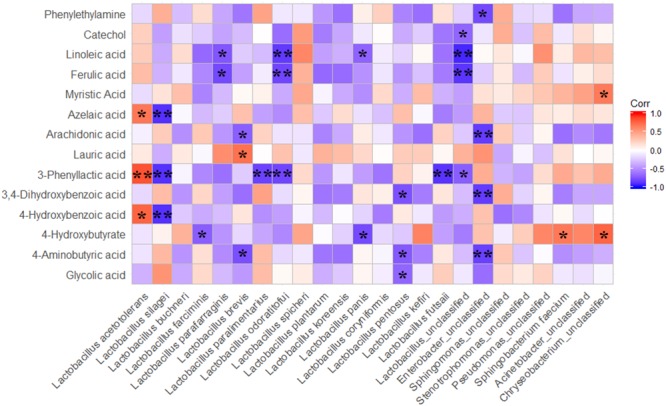
Spearman correlations between metabolites with biofunctional activity and main bacteria species. The differnentially presented metabolites during fermentation were screened by OPLS-DA; P-values are shown as ∗0.01 < P ≤ 0.05, ∗∗P ≤ 0.01.

Spearman correlations between metabolites with biofunctional activity and main bacteria species. The differnentially presented metabolites during fermentation were screened by OPLS-DA; P-values are shown as ∗0.01 < P ≤ 0.05, ∗∗P ≤ 0.01.