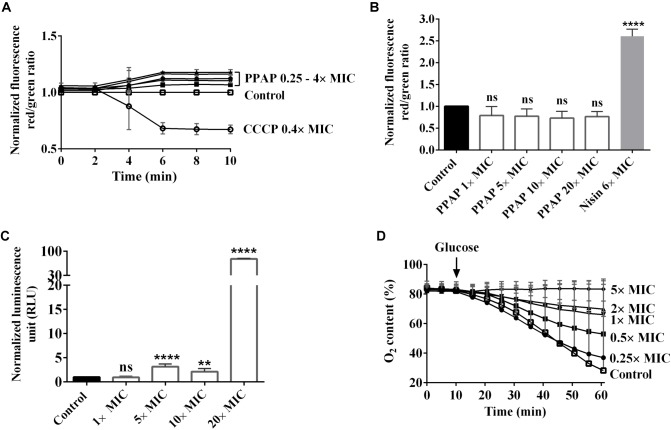
FIGURE 2.
Effect of PPAP 23 on the membrane of S. aureus. (A) Determination of membrane potential in PPAP 23 treated cells. S. aureus HG001 was treated with PPAP 23 at different concentrations, and the relative fluorescence ratios of DiOC2 (3) red/green were calculated. The proton ionophore, CCCP, was used as positive control. (B) Detection of membrane permeability and pore formation. Relative fluorescence intensity red/green is shown for S. aureus HG001 stained with propidium iodide and SYTO 9 in the presence or absence of PPAP 23 at varied concentrations for 30 min. Nisin was used as the positive control. (C) Measurement of ATP release in PPAP 23 treated cells. Relative luminescent signal of S. aureus HG001 treated with PPAP 23 at varied concentrations for 3 h was plotted. (D) Oxygen consumption was assayed with washed S. aureus HG001 cells in an OxoDish® OD24 plate reader. After 10 min preincubation with PPAP 23 at indicated concentrations, respiration was induced by the addition of 1.0 mM glucose and oxygen content (%) in the cells was recorded for 60 min. All data are mean values of 3 independent experiments. Error bars represent standard deviation. Data of (A–C) were normalized with the values of control, the untreated cells; Data of (B,C) were analyzed by one-way ANOVA with Dunnett’s multiple comparison with control, ns: no significant difference, ∗∗P < 0.01, ∗∗∗∗P < 0.0001.

