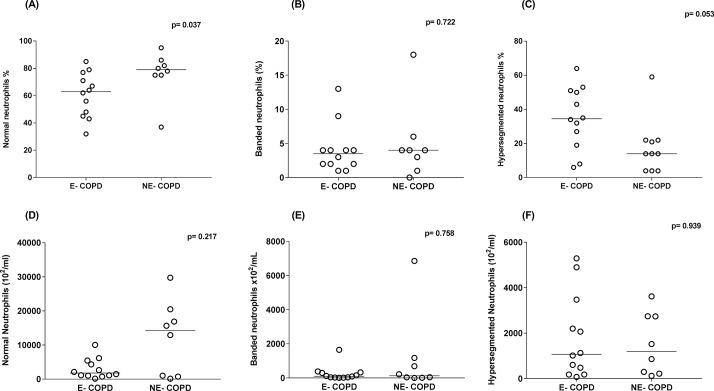
Figure 5.
Neutrophil subsets proportion (A–C) and neutrophil subsets number (D–F) in bronchial lavage of eosinophilic chronic obstructive pulmonary disease (E-COPD) and non-eosinophilic COPD (NE-COPD) participants. The line in dot plots of each group represents the median and the p value in each graph is an outcome of Wilcoxon rank-sum test.

