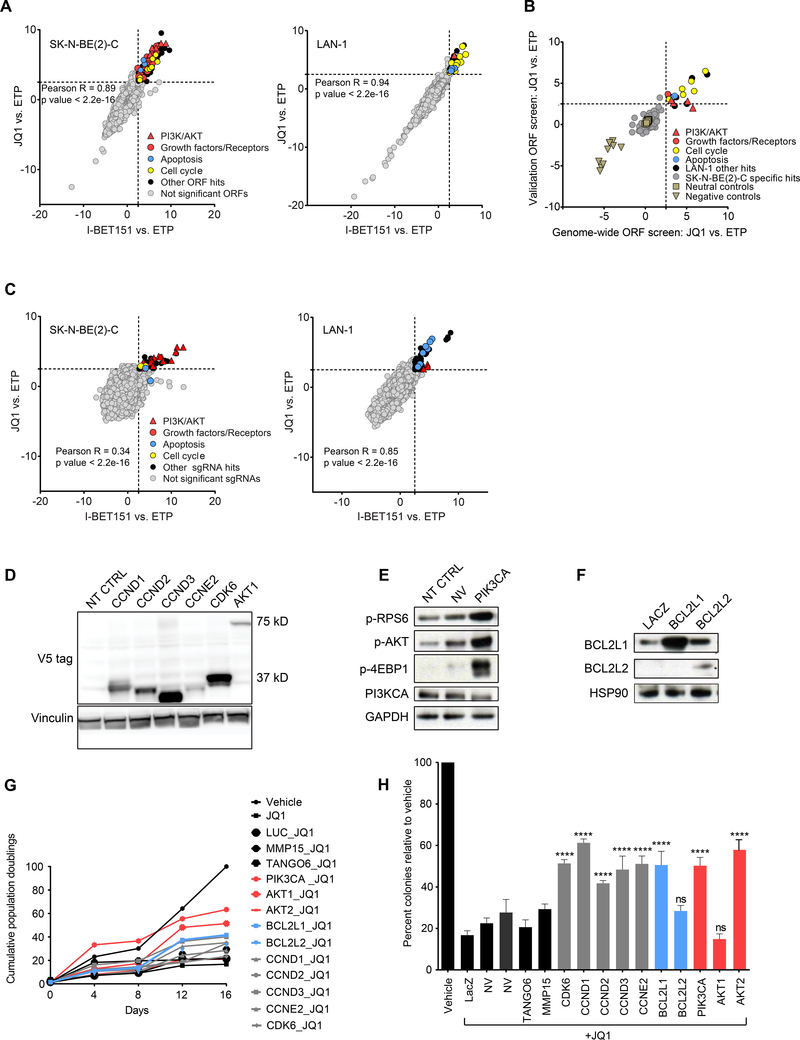
Figure 1: Genome-scale lentiviral ORF and CRISPR screens identify candidate drivers of BET inhibitor resistance in MYCN-amplified neuroblastoma.
A. Scatter plots of z-scores for log2 fold changes (log2(FC)) in ORF expression for JQ1 vs. ETP (y-axis) and I-BET151 vs. ETP (x-axis) in SK-N-BE(2)-C (left) and LAN-1 (right) cells. Genes with z-scores ≥ 2.5 with both BET inhibitors (dashed gray line) were nominated as candidate genes conferring resistance and classified as significant ORFs. B. Scatter plot showing the distribution of the JQ1 vs. ETP z-scores for the 150 ORFs included in the validation mini-ORF rescue screen in the LAN-1 cell line. C. Genome-scale pooled lenti-CRISPR screen in SK-N-BE(2)-C (left) and LAN-1 (right) cells under JQ1 and I-BET151 drug selection. Genes with z-scores ≥ 2.5 with both BET inhibitors (dashed gray line) were nominated as candidate sgRNAs conferring resistance and classified as significant sgRNAs. D-F. Western blots confirming overexpression of the indicated ORF hits with V5 antibody in cases where the V5 tag was expressed (D), or by antibodies directed against the ORF or downstream effectors (E, F) (p-AKT = pT308-AKT). G-H. Long-term viability assays (G) and colony formation assays (H) in SK-N-BE(2)-C cells overexpressing the indicated ORFs and treated with vehicle or 1 μM JQ1. Luciferase (LUC), LacZ, MMP15, and TANGO6 ORFs are included as negative controls. Data is presented as mean values of triplicate points ± standard deviation (SD), NT CTRL = non-targeting control ORF. NV= no virus. (* p value < 0.05, ** p value < 0.01, *** p value < 0.001, **** p value < 0.0001, Mann-Whitney nonparametric test). See also Figure S1 and Tables S1-S4.

