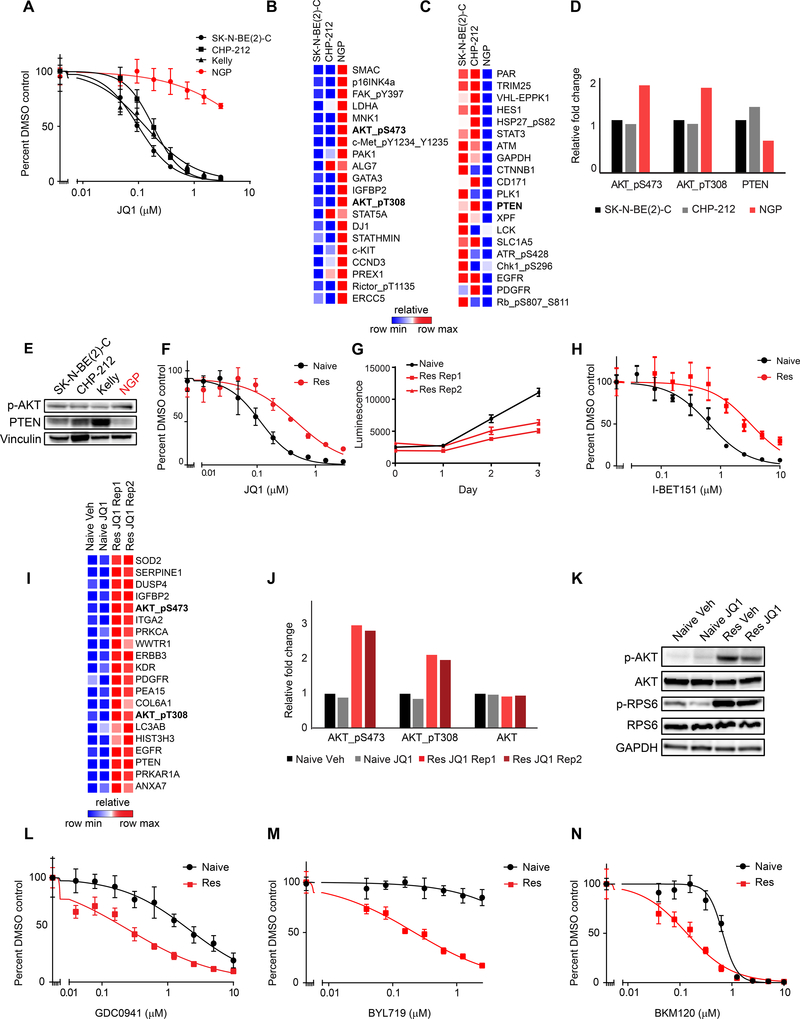
Figure 2: Characterization of innate and acquired BET inhibitor resistant MYCN-amplified neuroblastoma cell lines.
A. Viability analysis of JQ1 treatment in four MYCN-amplified neuroblastoma cell lines. B-C. RPPA data demonstrating the top 20 upregulated (B) and downregulated (C) proteins and phosphoproteins in JQ1 resistant NGP cells compared to JQ1 sensitive SK-N-BE(2)-C and CHP-212 cells. D. Quantification of pS473-AKT, pT308-AKT, total AKT and PTEN expression levels based on RPPA data. E. Western blots for p-AKT and PTEN in neuroblastoma cell lines. (p-AKT = pT308-AKT). F. Effects of JQ1 treatment on the viability of naive and JQ1 resistant (Res) SK-N-BE(2)-C cells. G. Absolute growth rates of SK-N-BE(2)-C naive cells treated with vehicle control and two replicates of JQ1 resistant cells treated with 1 μM JQ1. H. Effects of I-BET151 treatment on the viability of naive and JQ1 resistant SK-N-BE(2)-C cells. I. RPPA data demonstrating the top 20 most differentially expressed proteins in JQ1 resistant vs. naive SK-N-BE(2)-C cells treated with vehicle (Veh) or JQ1. J. Quantification of pS473-AKT, pT308-AKT, and total AKT levels from data shown in (I). K. Western blot of PI3K pathway activity in JQ1 resistant and naive cells. (p-AKT = pT308-AKT). L-N. Effects of the PI3K inhibitors GDC0941 (L), BYL719 (M), and BKM120 (N) on the viability of JQ1 resistant vs. naive SK-N-BE(2)-C cells. Results are presented as representative dose response curves of three independent experiments. Data is presented as mean values of eight technical replicates ± SD. See also Figure S2.

