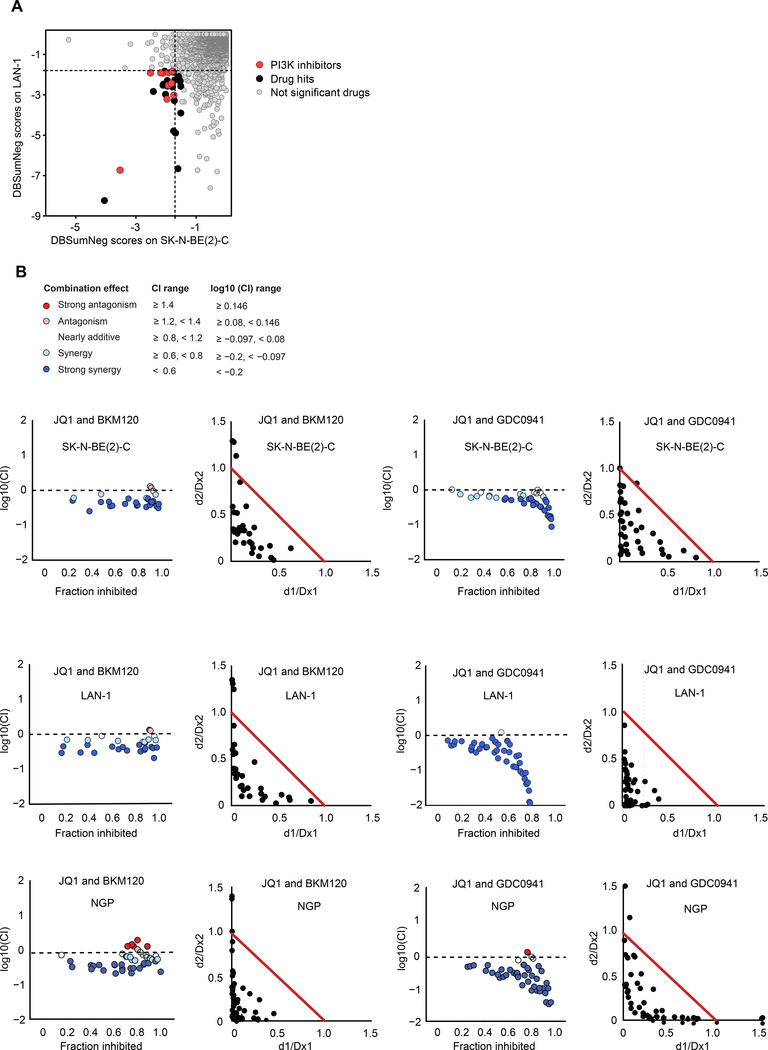
Figure 6: Chemical combinatorial screening identifies PI3K inhibitors as highly synergistic with JQ1 in MYCN-amplified neuroblastoma.
A. JQ1 screened against the Mechanism Interrogation PlatE (MIPE) library in SK-N-BE(2)-C and LAN-1 MYCN-amplified neuroblastoma cell lines. Synergy was assessed using the Bliss model. DBSumNeg is defined as the sum of negative deviations from the Bliss model. Dotted black lines indicate threshold for synergy. B. Synergy was assessed by Chou-Talalay combination index (CI) for JQ1 and the PI3K inhibitors, BKM120 and GDC0941, across the indicated cell lines. For CI plots, the x-axis represents fraction inhibited and the y-axis represents log10(CI). Normalized isobolograms depict CI scores over a range of concentrations. The coordinates of the CI scores are d1/Dx1 and d2/Dx2, where Dx1 is the concentration of drug 1 (JQ1) that alone produces the fractional inhibition effect x, and Dx2 is the concentration of drug 2 (PI3Ki) that alone produces the fractional inhibition effect x. The red line displayed is the line of additivity.
See also Figure S6 and Table S5.

