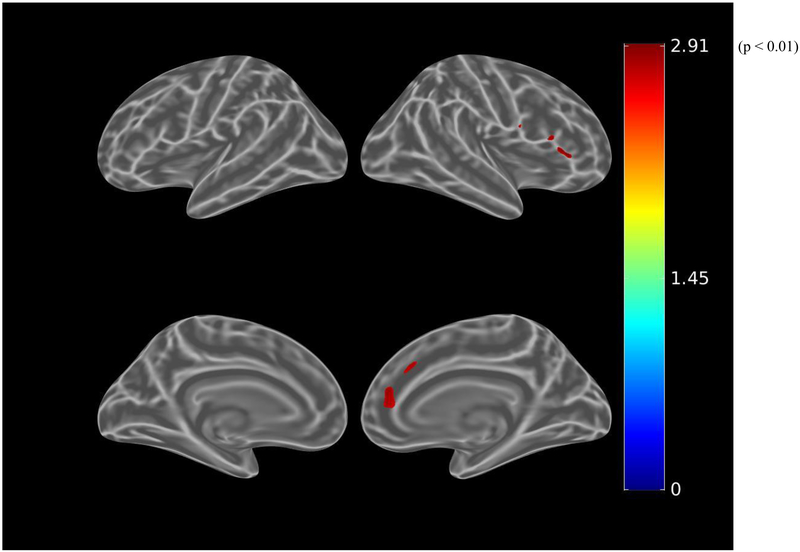
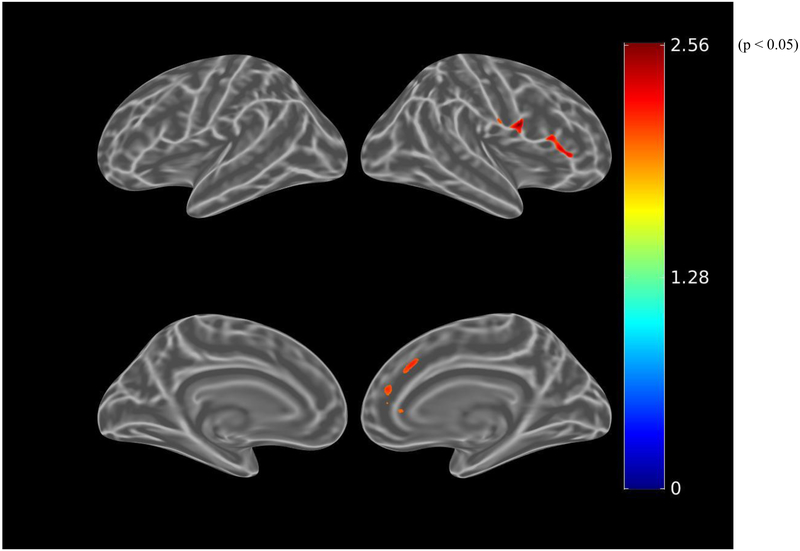
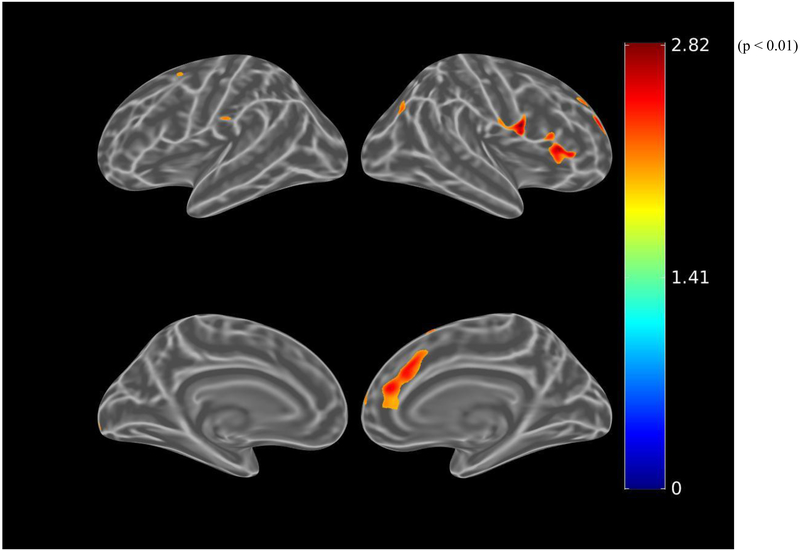
Figure 4.
Whole brain FTP PET SUVR T-statistics maps showing the unadjusted association between apathy (AES-I) and tau burden (FTP PET SUVR) in all participants (A), the association adjusted for age, sex, and MMSE (global cognition) (B), and in participants with greater amyloid burden (PiB-positive), the association adjusted for age, sex, and MMSE (C). Of note, the associations shown in these maps do not meet the p<0.001 threshold. Threshold was set at T>2.65, p<0.01 in order to show a wider range of results. For t=2.0, p=0.05; t=2.65, p=0.01; t=3.0, p=0.005. AES-I (Apathy Evaluation Scale Informant report), FTP (flortaucipir), MMSE (Mini-Mental State Exam), PET (positron emission tomography), PiB (Pittsburgh Compound B), SUVR (standardized uptake value ratio).


