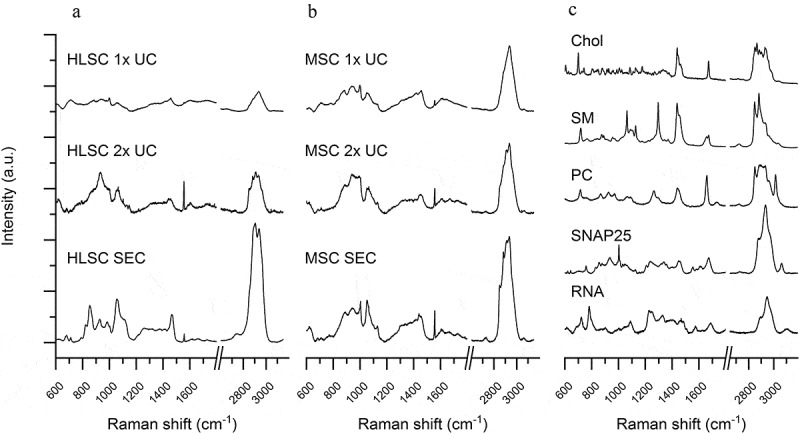
Figure 2.

Raman spectra of EV samples and reference molecules. a-b: Mean Raman spectra obtained on air-dried drop of EV samples isolated by 1x UC, 2x UC and SEC protocols from HLSC (a) and MSC (b) supernatants. All spectra were baseline corrected, aligned and normalised before averaging. c: Representative Raman spectra of reference molecules: cholesterol (Chol), sphingomyelin (SM), phosphatidylcholine (PC), SNAP 25 recombinant protein and single stranded RNA. All spectra were obtained with 532 nm laser line and 30 s of exposure for 2 accumulations.
