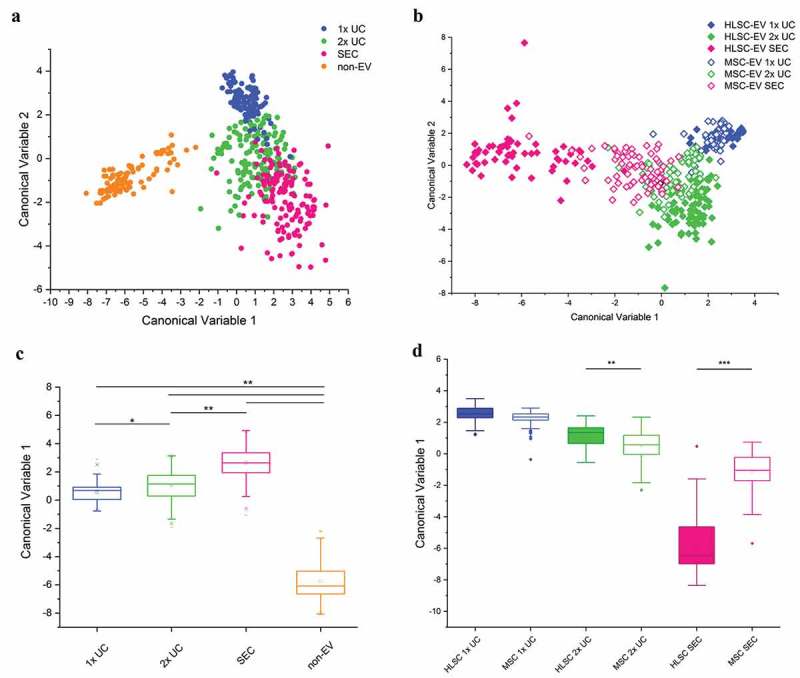
Figure 3.

Multivariate statistical analysis of Raman spectra. PCA-LDA analysis performed on all spectra obtained on EV and non-EV samples from HLSC and MSC (n ≥ 25 per sample). a,b: Scatter plots representing the values obtained for the Canonical Variable 1 and Canonical Variable 2 after LDA. In the classification model shown in (a), spectra from EVs were grouped based on their isolation method and non-EV spectra were analysed as an internal control. In (b), spectra were grouped based on both isolation method and cell source. In both analyses, the first 20 PC scores calculated by means of PCA were used for the LDA. Each dot represents a single spectrum. c,d: Box plots representing the Canonical Variable 1 obtained for every considered group of samples after the corresponding LDA analysis. In (c), the ability of RS to distinguish between EV and non-EV samples and between EV samples isolated by means of different protocols was verified. In (d), the Canonical Variable 1 was considered to evaluate the ability of RS to distinguish between HLSC- and MSC-derived EVs, isolated by different procedures. * indicates p < 0.05, ** p < 0.01, *** p < 0.001 after one-way ANOVA with Tukey post-hoc test.
