
Figure 1.
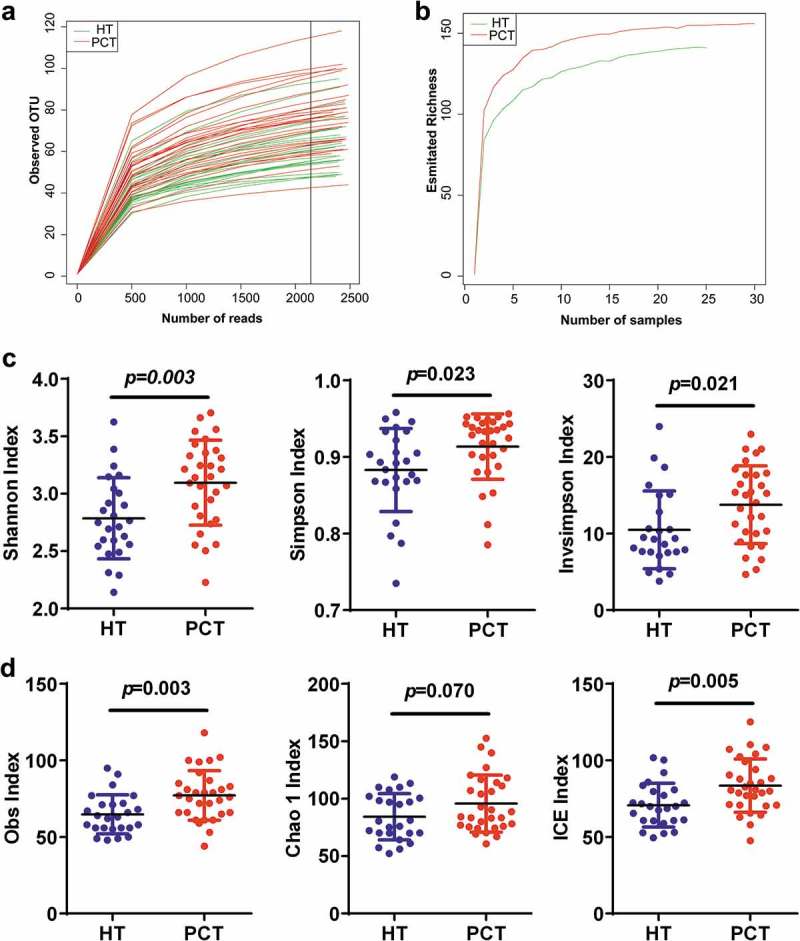
Phylogenetic diversity of tongue coating microbiota among individuals and between PC patients and healthy subjects.
(a) Rarefaction analysis of bacterial 16S rRNA gene sequences was used to evaluate if further sequencing would likely detect additional taxa, indicated by a plateau. (b) Richness index curves that evaluate the number of samples likely required to identify additional taxa indicated by a plateau. (c) Scatterplots depict microbiota diversity differences according to the Shannon index, Simpson index and invsimpson index between the PCT and HT. (d) Scatterplots depict microbiomes diversity differences according to the Obs index, Chao 1 index and ICE index between PCT and HT. Plot parameters, the ‘black line’ symbol represents median value, and the upper and lower ranges of the plots represent the 75% and 25% quartiles, respectively. PCT, pancreatic cancer patients tongue coat; HT, healthy subjects tongue coat.