
Figure 4.
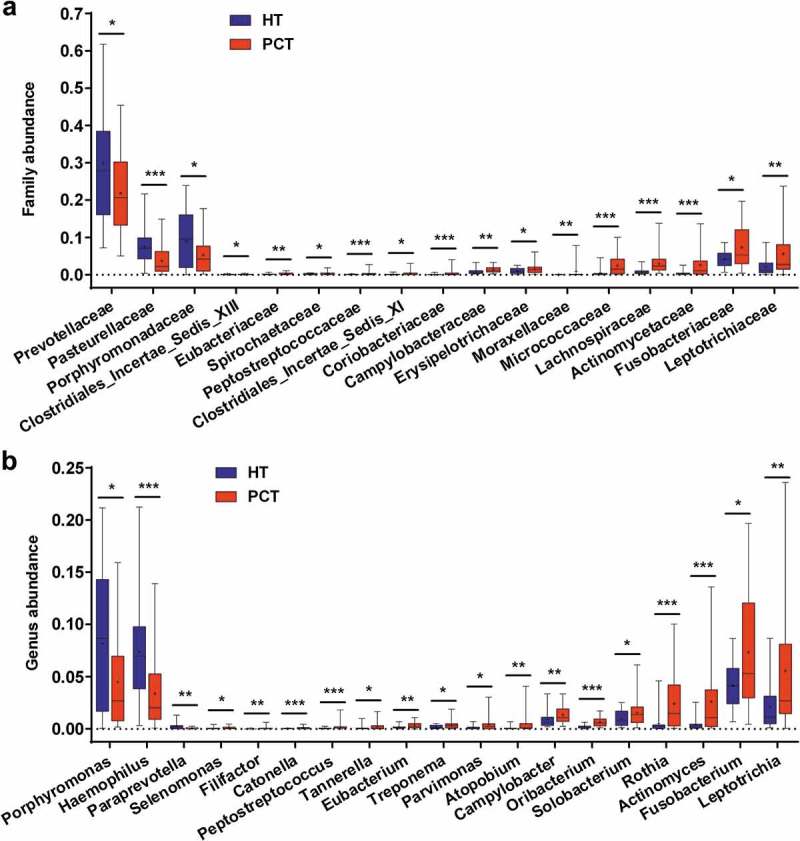
Comparison of the microbiome at the family (a) and genus (b) levels between PCT (red) and HT (green), respectively.
Box parameters, the ‘+’ symbol represents median value, and the upper and lower ranges of the box represent the 75% and 25% quartiles, respectively; P values were calculated using the nonparametric Mann–Whitney test and were shown in Supplementary Datasets S2_b (Family) and_c (Genus); significant correlations by *P < 0.05; **P < 0.01 and ***P < 0.001. PCT, pancreatic cancer patients tongue coat; HT, healthy subjects tongue coat.