
Figure 6.
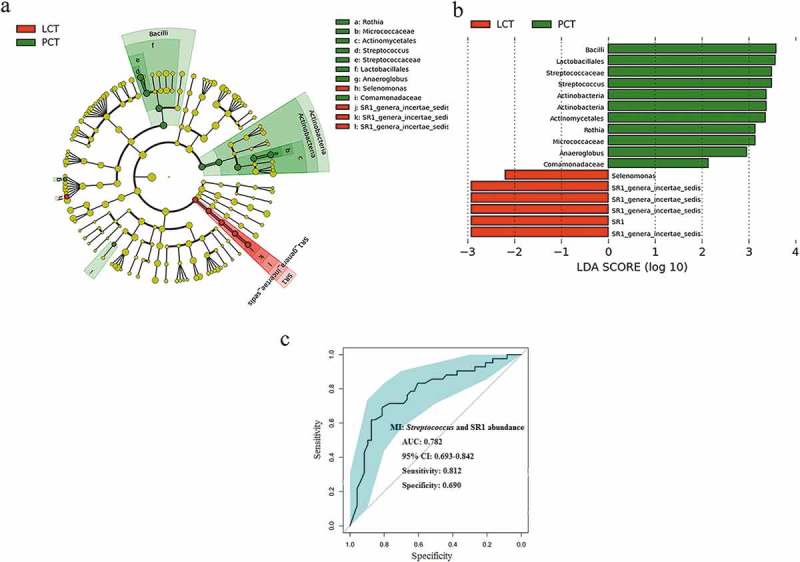
LEfSe and LDA analysis based on OTUs characterize microbiota between the PCT and LCT.
(a) Cladogram using the LEfSe method indicating the phylogenetic distribution of tongue coat microbes associated with patients with PC (green indicates phylotypes statistically overrepresented in PCT) and LC (red indicates phylotypes overrepresented in LCT). Each filled circle represents one phylotype, and phylum and class are indicated in their names on the cladogram and the order, family, or genera are given on the right panel. (b) A histogram of the linear discriminant analysis (LDA) scores was calculated for the selected taxa which showed the significant bacterial difference between the PCT and LCT. LDA score at the log10 scale is indicated at the bottom. The greater the LDA score is, the more significant the microbial biomarker is in the comparison. (c) Significant differences in the abundance of predominant genera between the cancer patients and the healthy controls. The average abundance values for each bacterium is depicted as mean ±SEM. P values were calculated using the nonparametric Mann–Whitney test, and are shown in Supplementary table S2. Significant differences by *P < 0.05; **P < 0.01 and ***P < 0.001. HT, healthy subjects tongue coat; PCT, pancreatic cancer patients tongue coat; LCT, liver cancer patients tongue coat.