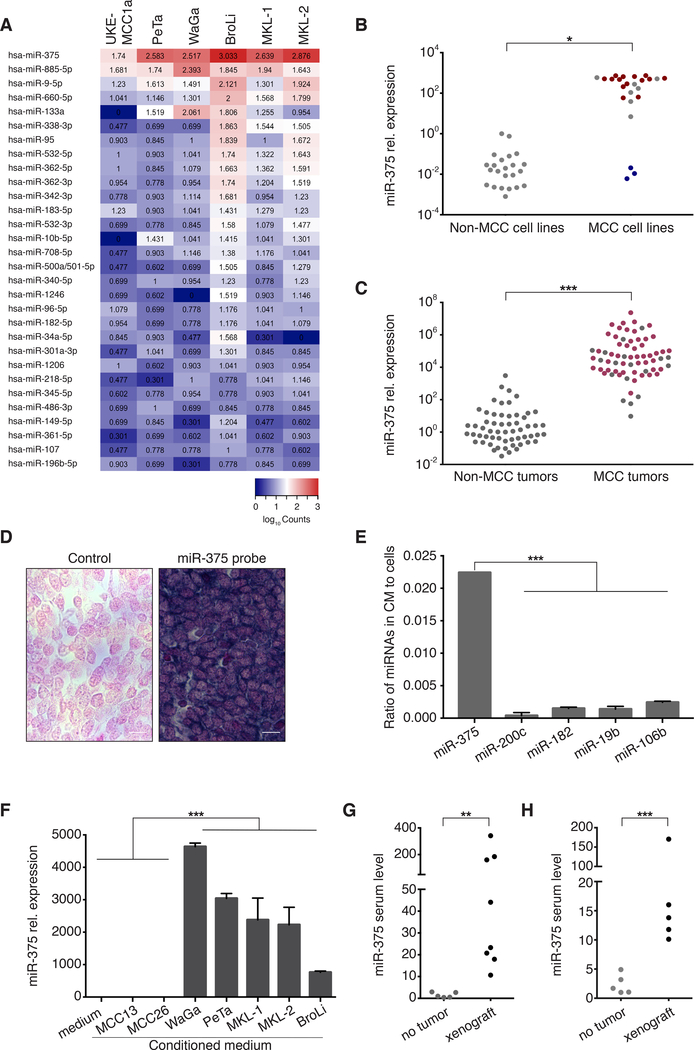
Fig. 2:
The highly expressed miR-375 in MCC cell lines and tissues is also present as cell-free miRNA in MCC-conditioned media as well as in sera of MCC-bearing preclinical models.
A: Heat map depicting the relative expression of the 30 most abundant miRNAs in six MCC cell lines. Data obtained by nCounter® Human v2 miRNA Expression Assay (NanoString Technology). B: miR-375 expression in 24 MCC cell lines (21 classical MCPyV positive [n=14, red] or negative [n=7, gray], and three variant MCC cell lines [blue]; details in S. Tab. 1) as well as 23 non-MCC skin cancer (melanoma, squamous cell carcinoma), lung cancer, kidney, and fibroblast cell lines (details in S. Tab. 2) was quantified by RT-qPCR in triplicates. The relative expression of miR-375 was normalized to U6 and is depicted relative to 293T cells as calculated by the 2-ΔΔCq method. C: miR-375 expression in 58 non-MCC skin cancer tissue samples (48 melanomas and ten basal cell carcinomas) as well as 67 MCC tissue samples (49 MCPyV positive [red] and 18 MCPyV negative [gray]) was determined by RT-qPCR in triplicate. The expression level of miR-375 was normalized to U6 and is depicted relative to one randomly selected melanoma sample as calculated by the 2-ΔΔCq method. D: In situ hybridization (ISH) for miR-375 in a representative MCC tissue. Intense miR-375 ISH signal (right), and background staining for the scrambled control (left). Scale bar, 10 μm. E: The presence of miR-375, miR-200c, miR-182, miR-19b and miR-106b in 200μl of conditioned medium from the MCC cell line WaGa (48 hours culture of 106 cells per ml) and in the cells themselves was determined by RT-qPCR in triplicate. The ratio of respective miRNA calculated by the 2-ΔΔCq method in conditioned medium to the cells is depicted. F: miR-375 presence in conditioned medium from seven different MCC cell lines was determined in triplicate. The expression level of miR-375 was normalized to spiked-in cel-mir-39 and is depicted relative to MCC13-conditioned medium as calculated by the 2-ΔΔCq method. G: Circulating cell-free (cf) miR-375 in sera of chicken embryos bearing 4-day-old xenotransplants of WaGa MCC cells on the chorioallantoic membrane was determined by RT-qPCR in triplicate. The expression level of miR-375 was normalized to spiked-in cel-mir-39 and is depicted relative to the serum of an untreated chicken embryo as calculated by the 2-ΔΔCq method. H: cf miR-375 in sera of NOD.CB17-Prkdcscid/J mice with or without subcutaneous WaGa MCC xenografts was determined by RT-qPCR in triplicate. The expression level of miR-375 was normalized to spiked-in cel-mir-39 and is depicted relative to the sera of tumor-free NOD.CB17-Prkdcscid/J control mice as calculated by the 2-ΔΔCq method. Mann-Whitney U test were performed as described in Statistical analysis; p*<0.05, p**<0.005, p***<0.001.

