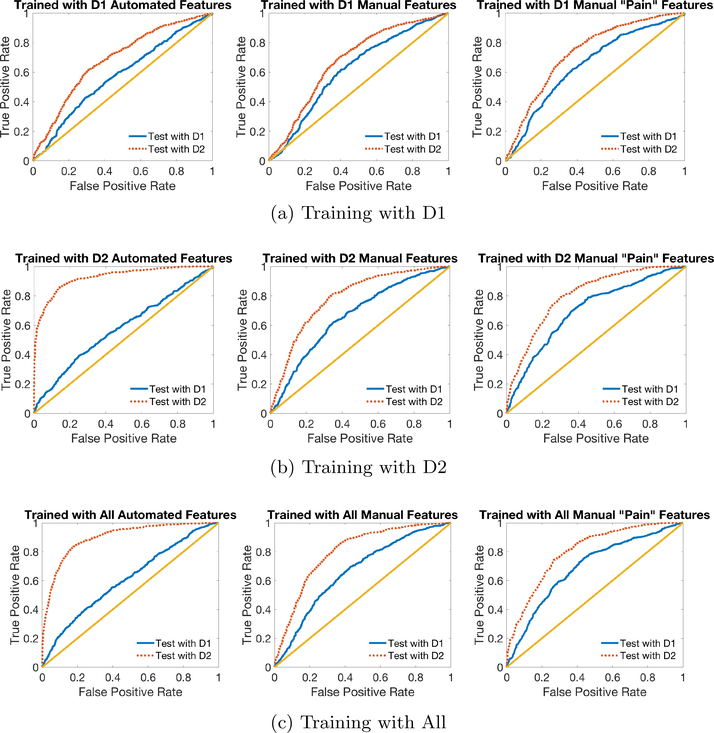
Fig. 3:
ROC Curves for classification on D1 and D2 using automated features (left), manual features (middle) and pain-related manual features (right), when the model is trained on (a) D1, (b) D2 and (c) All data. The dotted (red) lines are ROCs when the machine is able to use environment information to differentiate pain and no-pain conditions, and the solid (blue) lines show the machine’s ability to discriminate between pain and no-pain based on AU information alone. The straight (yellow) line graphs the performance of random chance.

