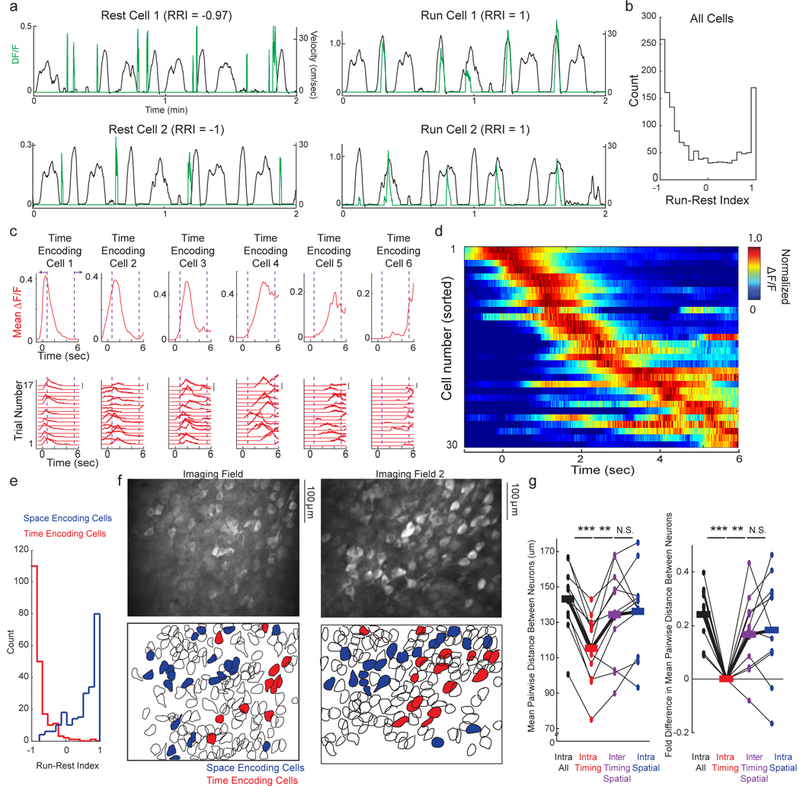
Figure 2:

Functionally and anatomically clustered populations of neurons in MEC encode space during locomotion and elapsed time during immobile intervals of the Door Stop task. a. DF/F traces of significant transients (green traces) from individual example Rest Selective Cells (left) and Run Selective Cells (right) during running and resting periods (black traces) in Door Stop task. b. Histogram of RRI for all active cells, across all FOVs in all mice during Door Stop task; transition periods and reward zone excluded. c. Bottom, DF/F versus time for each correct trial of a single session for 6 individual neurons from the same FOV during the 6 second Door Stop wait interval. Scale bars indicate 100% DF/F. Top, Mean DF/F versus time across all correct trials. Purple dashed lines and arrows indicate transition period. d. Mean DF/F versus time across all correct trials in a single session for all neurons (each row represents single neuron mean DF/F) in a single FOV during the 6 second Door Stop wait interval. Mean DF/F normalized to peak for each neuron (each row). e. Histogram of RRI for all time encoding cells (red) and all spatial encoding cells (blue) across all FOVs in all mice during Door Stop task; transition periods and reward zone excluded. f. MEC FOVs of GCaMP6f labeled populations (top) colored red or blue to indicate cells encoding time or space (bottom), respectively. g. Mean pairwise distance (left) or fold-change (right) between neurons in various groups (x-axis). All spatial or time encoding cells from all mice in Door Stop task. Black lines connecting measures (dots) from same FOV, thick lines are mean across all FOVs. (n = 11 imaging fields from 7 mice; Repeated Measures ANOVA F = 11.8, P<0.0001; intra time-time vs intra all-all, P<0.001 Tukey’s post-test with Bonferroni Correction; intra time-time vs inter time-space, P<0.01 Tukey’s post-test with Bonferroni Correction.) Interestingly, spatial cells were not significantly clustered compared to all cells even though we previously found grid cells were clustered compared to non-grid cells (see reference 25). This difference is likely due to the heterogeneous spatial cell population defined here, which likely includes grid, border and spatially selective non-grid cells. *** indicate P<0.001. ** indicate P<0.01.
