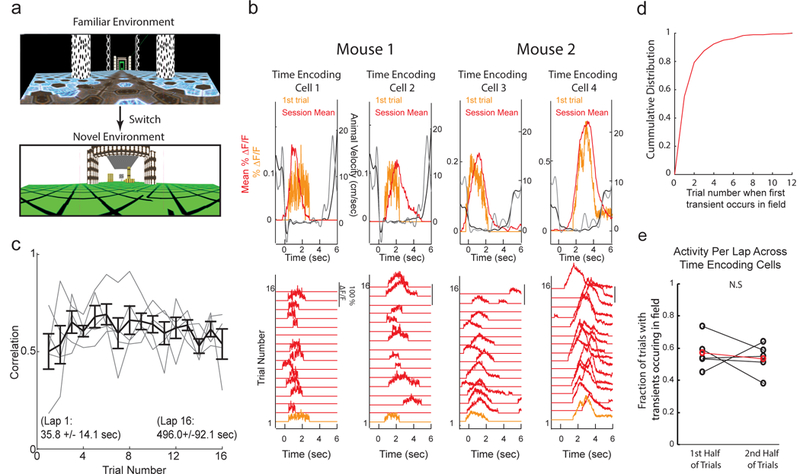
Figure 5:

The temporal representation formed by populations of time encoding cells in MEC is present from the first moments of new experiences. a. Views of linear tracks mice navigated in during environment switch paradigm. b. Bottom, DF/F versus time for each voluntary rest period (wait trial) of a single session for 4 individual neurons from 2 different mice during first session in novel linear track (see 5a). Rest period 1 was the first time the mice ever stopped to rest in the novel track (orange trace). Top, Mean DF/F (red) and velocity (black) versus time across all rest periods; DF/F (orange) and locomotion velocity (grey) from first rest period. Note, negative deflection in mouse velocity trace reflects backwards movements on the treadmill. c. Pearson’s Correlation between the calcium transients during each rest period and the mean timing field over all periods (y-axis) as a function of number of wait periods in novel environment (x-axis); grey = mean across all cells in a single FOV in a single session; black = mean ± SEM across all cells in all sessions. N = 5 imaging fields across 3 mice. d. Cumulative distribution of the trial number on which a transient first occurred in the significant timing field in the novel session across all time encoding cells. e. Mean fraction of trials with transients occurring within the significant timing field across all cells for the first half of wait trials in the session versus the second half of wait trials in the session. (n = 5 imaging fields from 3 mice; P = 0.1875 two-sided Paired Wilcoxon Signed Rank Test).
