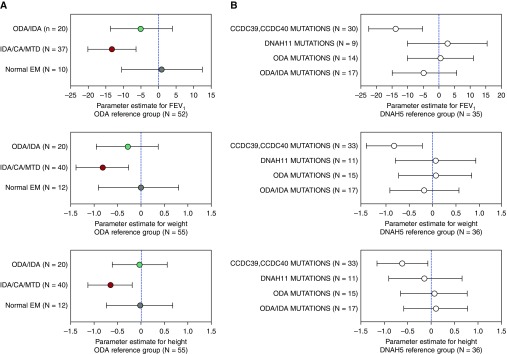
Figure 3.
(A) Forest plots of association of percent predicted FEV1 and weight and height z-scores with ciliary ultrastructural defects: ODA (reference group, n = 55), ODA/IDA (n = 20), IDA/CA/MTD (n = 40), and normal EM (n = 12). Linear mixed effects models including data from all study visits were used to estimate the overall association between clinical feature and defect group. (B) Forest plots of association of percent predicted FEV1 and weight and height z-scores with primary ciliary dyskinesia mutations. DNAH5 (reference group, n = 36), CCDC39 and CCDC40 (n = 33), DNAH11 (n = 11), other ODA (n = 15), and ODA/IDA (n = 17). Linear mixed effects models including data from all study visits were used to estimate the overall association between clinical feature and genetic defect group. CA = central apparatus; EM = electron micrographs; IDA = inner dynein arm; MTD = microtubular disorganization; ODA = outer dynein arm.

