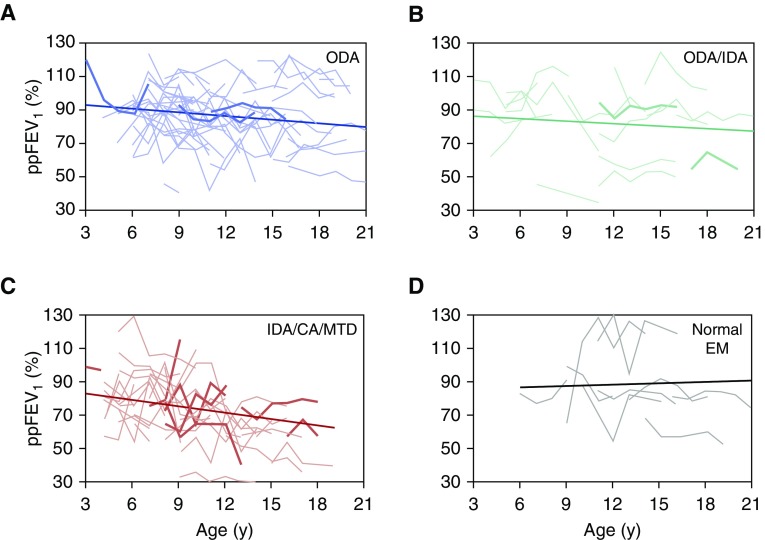
Figure 4.
Estimated mean annual change in percent predicted FEV1 (ppFEV1) for each ciliary ultrastructural defect. (A–D) Change in lung function with age for each individual in each defect group, with the estimated slope for that defect group superimposed. (A) ODA, ppFEV1 = 95.54 − 0.73 × age (yr). (B) ODA + IDA, ppFEV1 = 88.22 − 0.48 × age (yr). (C) IDA/CA/MTD, ppFEV1 = 85.54 − 1.1 × age (yr). (D) Normal EM, ppFEV1 = 85.77 + 0.29 × age (yr). Estimated slopes are from linear mixed effects models including ultrastructure defect group, age in years, and the interaction between them as fixed effects. Individuals with the bold lines are those who were diagnosed based on an ultrastructural defect without a corresponding genetic mutation. For definition of abbreviations, see Figure 3.

