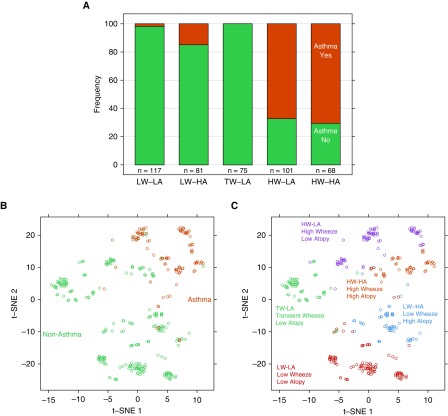
Figure 3.
Distributions of asthma diagnosis by URECA clusters. (A) The frequency (%) of asthma was greater in the high-wheeze/low-atopy and high-wheeze/high-atopy clusters (P < 0.01). (B and C) A two-dimensional distance matrix used in the construction of childhood URECA phenotype by asthma (B) and cluster group (C) is described by using t-distributed stochastic neighbor embedding, a novel dimension-reduction technique for high-dimensional data. HA = high atopy; HW = high wheeze; LA = low atopy; LW = low wheeze; t-SNE = t-distributed stochastic neighbor embedding; TW = transient wheeze; URECA = Urban Environment and Childhood Asthma.

