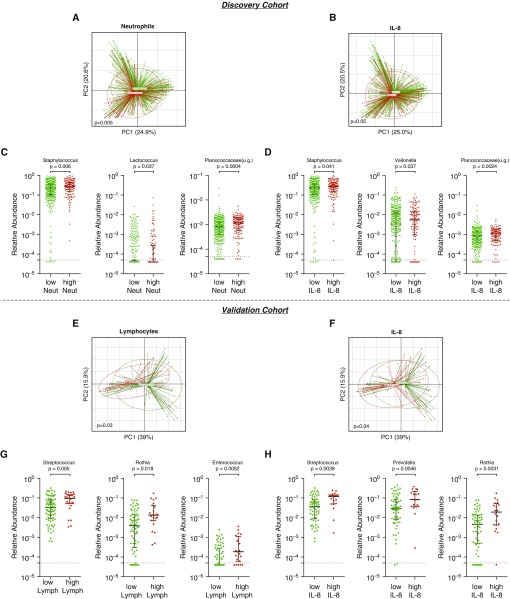
Figure 3.
Changes in nasal microbiota associated with levels of inflammatory markers in the discovery and validation cohorts. (A) β diversity differences between high and low neutrophils in the discovery cohort (permutational multivariate ANOVA [PERMANOVA] P < 0.005). (B) β diversity differences between high and low IL-8 levels in the discovery cohort (PERMANOVA P < 0.05). (C) The nasal microbiota of lavages with high neutrophils was enriched with Staphylococcus, Lactococcus, and Planococcaceae(u.g.) (Mann-Whitney). (D) The nasal microbiota of lavages with high IL-8 was enriched with Staphylococcus, Veillonella, and Planococcaceae(u.g.) (Mann-Whitney). (E) β diversity differences between high and low lymphocyte levels in the validation cohort (PERMANOVA P < 0.03). (F) Significant differences were noted in β diversity when comparing high versus low IL-8 (PERMANOVA P = 0.04). (G) The nasal microbiota of lavages with high lymphocytes was enriched with Streptococcus, Rothia, and Enterococcus (Mann-Whitney). (H) The nasal microbiota of lavages with high IL-8 was enriched with Streptococcus, Prevotella, and Rothia (Mann-Whitney). Samples with taxa less than 5.0 × 10⁻⁵ relative abundance were considered below the lower limit of detection (dotted line). lymph = lymphocytes; neut = neutrophils; PC = principal coordinate; u.g. = undefined genus.

