Figure 2.
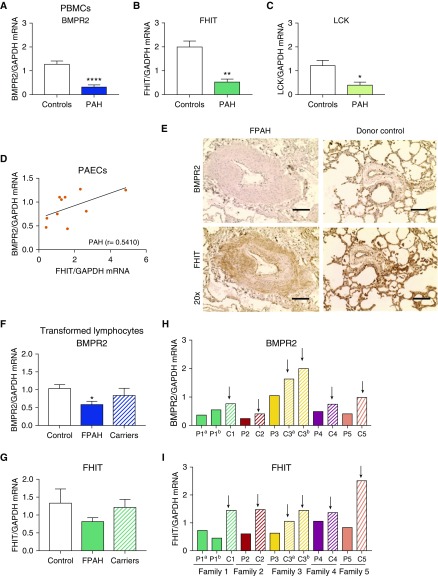
Attenuated FHIT (fragile histidine triad) expression in pulmonary arterial hypertension (PAH) correlates with decreased BMPR2 (bone morphogenetic protein receptor type 2) expression. (A–C) Quantitative PCR (qPCR) analysis of BMPR2 (A), FHIT (B), and LCK (lymphocyte-specific protein tyrosine kinase) (C) mRNA expression in peripheral blood mononuclear cells from patients with end-stage PAH with negative BMPR2 mutation status compared with healthy control subjects (control, n = 12; PAH, n = 8; mean ± SEM; *P < 0.05, **P < 0.01, ****P < 0.0001 vs. control, Welch’s t test). (D) Correlation and linear regression analysis of BMPR2 and FHIT mRNA expression in pulmonary artery endothelial cells from patients with idiopathic PAH (IPAH) at the time of lung transplant (control, n = 6; IPAH, n = 6; familial PAH [FPAH], n = 4; control, r = −0.7714; PAH, r = 0.5410; IPAH, r = 0.5218; Spearman r; for patient demographics, see Table E1B). (E) Representative pulmonary anti-BMPR2 and anti-FHIT immunohistochemistry (horseradish peroxidase, brown staining) in lung tissue from patients with PAH and donor control subjects at time of transplant (n = 3; for patient demographics, see Table E1C; scale bars, 20 μm). (F and G) qPCR analysis of FHIT and BMPR2 expression in transformed lymphocytes from patients with FPAH, nonaffected BMPR2 mutation carriers, and healthy control subjects (n = 10; mean ± SEM; *P < 0.05, one-way ANOVA, Dunnett post hoc test; for patient demographics, see Table E1A). (H and I) qPCR analysis of FHIT and BMPR2 expression in transformed lymphocytes from selected families (n = 5; P indicates patients with FPAH; C indicates healthy mutation carrier; the arrows point toward the carriers with consistently increased FHIT and BMPR2 compared with their FPAH family members; for patient demographics, see Table E1A). PAEC = pulmonary artery endothelial cell; PBMC = peripheral blood mononuclear cell.

