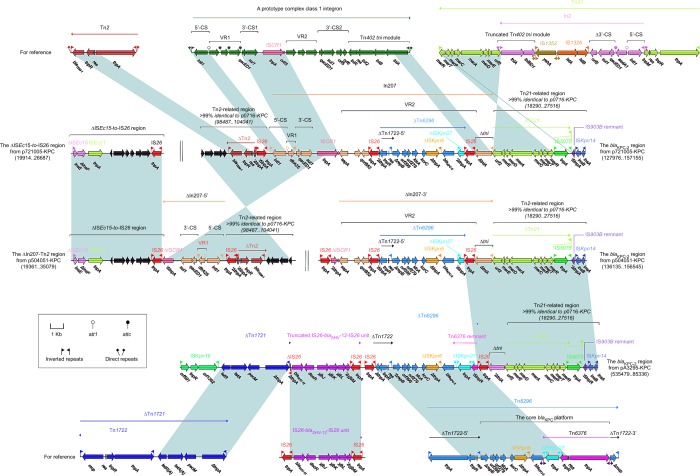
Figure 3.
The blaKPC-2 regions and related regions from p7210005-KPC, p504051-KPC, and pA3295-KPC.
Notes: Genes are denoted by arrows. Genes, mobile elements, and other features are colored based on function classification. Shading denotes regions of homology (>95% nucleotide identity). Numbers in brackets indicate nucleotide positions within corresponding plasmids.

