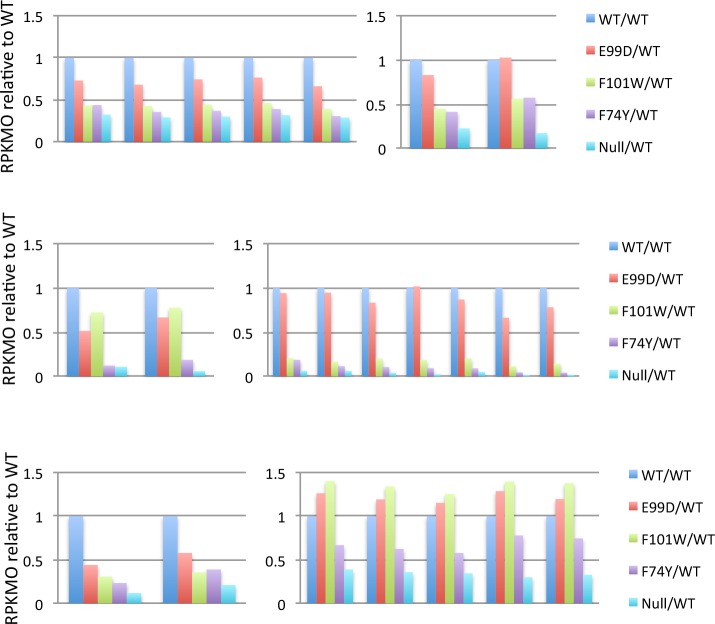
Fig 7. RNA-seq analysis of genes and operons positively regulated by CodY.
Transcript levels (RPKMO values relative to wild-type, which was set at 1.0) in the codY null mutant and each of three point mutants are shown for examples of the 57 genes whose transcript levels were >3-fold lower in the codY null mutant than in the wild-type strain. The different colored patterns for each gene indicate the relative transcript levels in each of the mutant strains. Sections A-F present the results for all the genes of six different clusters. In clusters A and B, the gene names are their numbers in the R20291 genome.

