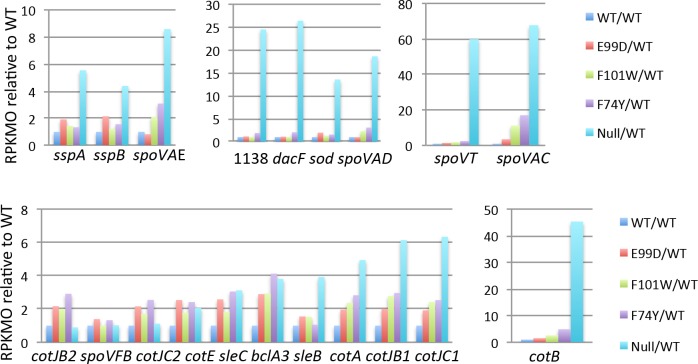
Fig 14. RNA-seq analysis of sporulation genes dependent on σG or σK.
Expression patterns of individual σG-dependent (A-C) and σK-dependent (D-E) genes in a panel of codY mutants. Transcript levels (RPKMO values) are presented relative to the levels in the wild-type strain (set at 1.0). The different colored patterns within each part of the figure reflect the behavior of individual genes. Part E displays the results with a single gene (cotB), but all other parts of the figure show collections of unlinked genes that have similar levels of overexpression in the codY null mutant.

