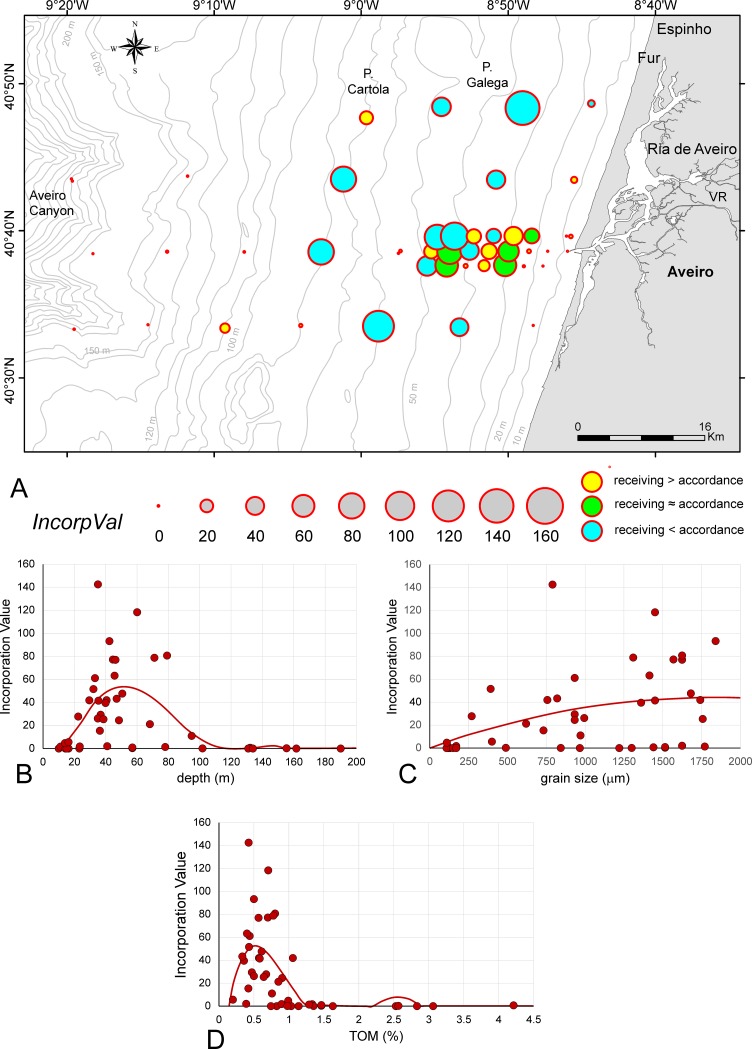
Fig 6. ‘Incorporation Values’ of sites in the investigation area.
A. ‘Incorporation Values’ represented as circle areas. B. Dependence of ‘Incorporation Values’ from depth fitted by 6th order power function. C. Dependence of ‘Incorporation Values’ from grain size fitted by 2nd order power function. D. Dependence of ‘Incorporation Values’ from TOM fitted by 5th order power function. Full line: significant correlation.

