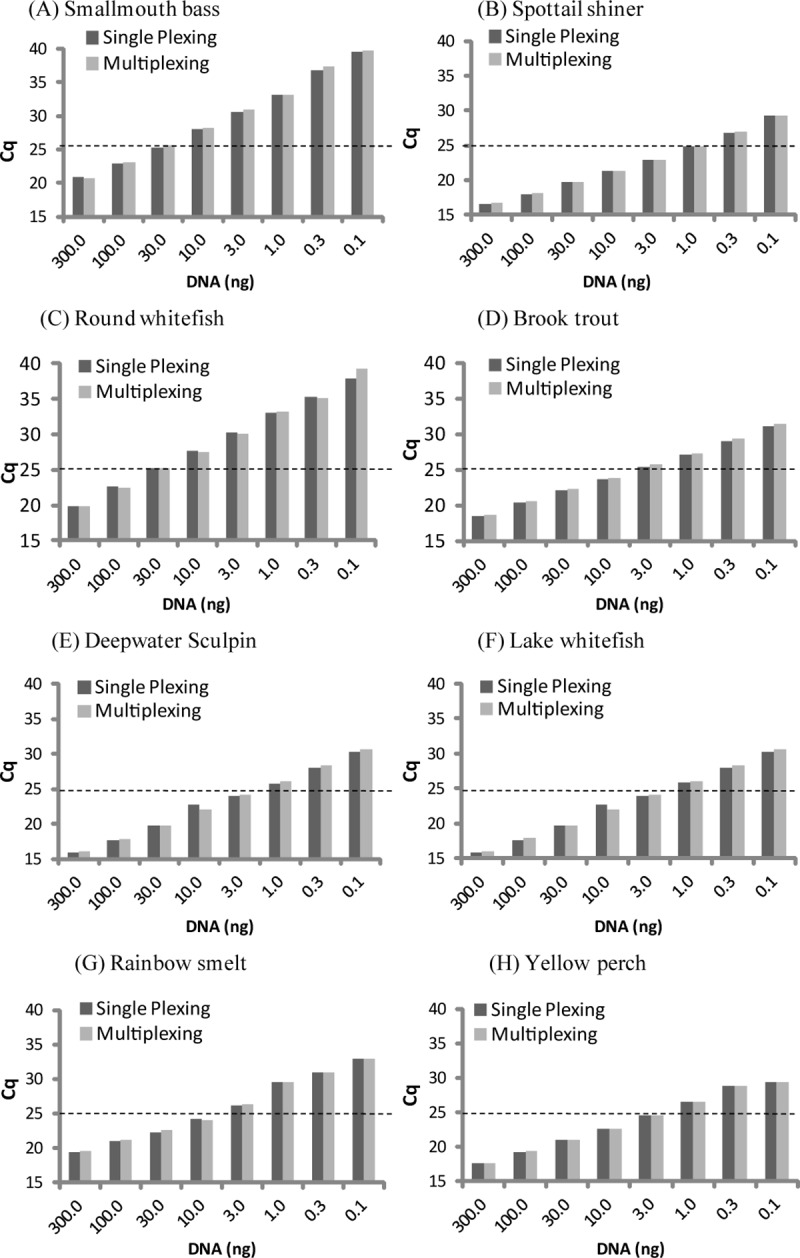
Fig 1. DNA concentration versus qPCR Cq values for each of the species-specific primers/probe sets.

Data represents DNA concentrations from 0.03 ng to 300 ng under single-plex and multiplex qPCR conditions. Sensitivity of primer-probe set highlighted by the species-specific Cq cut-off value of 25 (dotted line).
