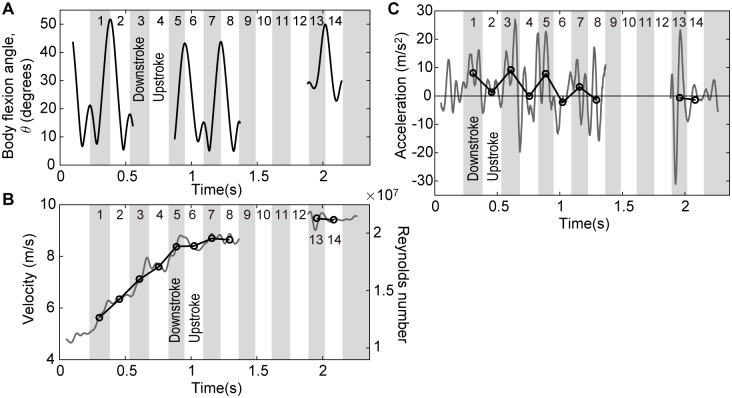
Fig 7. Time histories of the measured motion parameters.
(A) The bending angle, θ. (B) Velocity and Reynolds number. (C) Acceleration. Open circles indicate stroke-averaged values. Strokes are numbered from 1 to 14. The fluke marker was out of sight during the 3rd, 4th, and 9-12th strokes. Velocity and acceleration data between the 9th stroke and the 12th strokes were excluded from the following analysis since the lateral markers were out of sight. See also S3 and S4 Datasets for the timings of key events and the time-series data of the velocity and acceleration, respectively.

