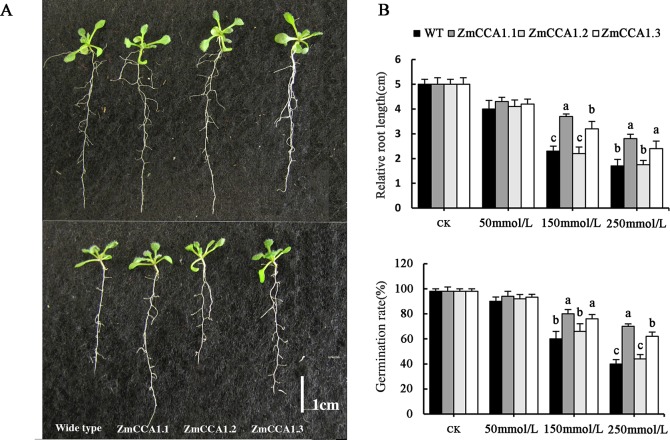
Fig 4. Phenotype analysis of transgenic A. thaliana lines under drought stress for 2 weeks under LDs.
(A) Representative images of 14-day-old transgenic A. thaliana overexpression lines and wild-type (WT) seedlings under normal (upper panel) and 150 mmol/L mannitol treatment condition (lower panel). (B) Relative root lengths and germination rates of WT and transgenic A. thaliana overexpression lines under 0–250 mmol/L mannitol. Vertical bars represent standard deviations from the mean. CK, seedlings grown under normal condition. Scale bars in (A) represent 0.5 cm. The different letters (a, b, and c) represent significant differences by ANOVA (P < 0.05).

