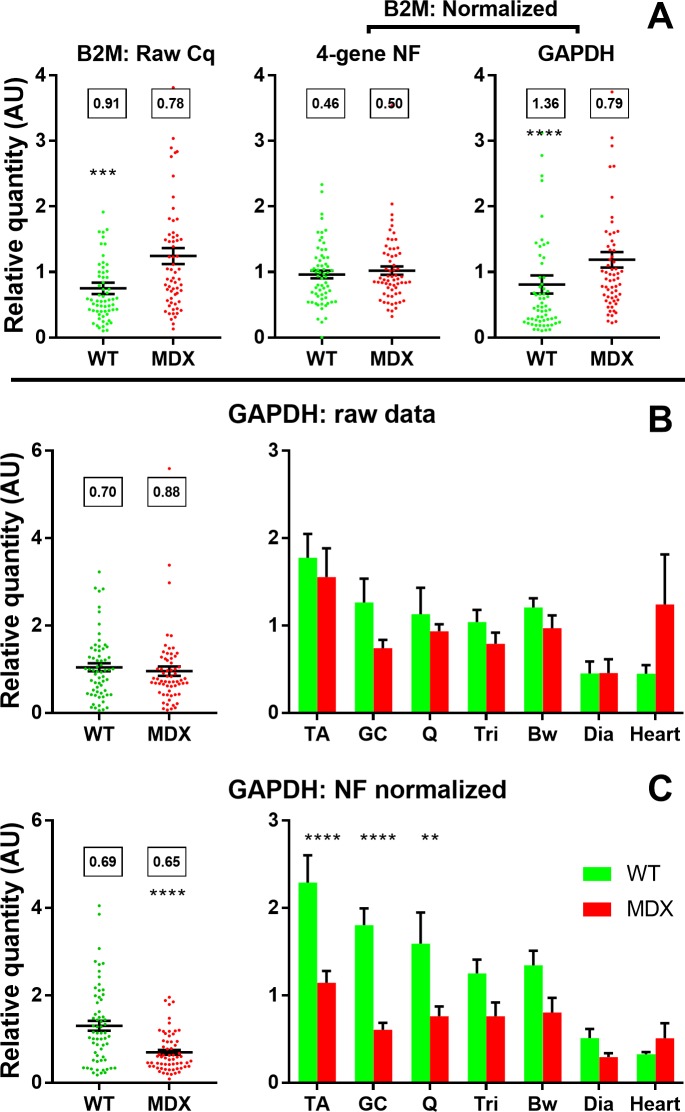
Fig 6. Beta 2 microglobulin and Glyceraldehyde 3-phosphate dehydrogenase expression.
(A) Expression data for B2M in all healthy and dystrophic samples, either raw relative quantity (RQ) values (left); normalized to the geometric mean of ACTB, RPL13a, CSNK2A2 and AP3D1 (centre); or to GAPDH (right). (B) and (C) Expression data for GAPDH in all healthy and dystrophic samples (left), or healthy and dystrophic samples sorted by muscle group (as indicated, right), either raw (B) or normalized to the geometric mean of ACTB, RPL13a, CSNK2A2 and AP3D1 (C). All data shown either as means +/- SEM plus individual sample RQ values (●) or as means + SEM alone. **:P<0.01,***:P<0.001,****:P<0.0001 (Mann-Whitney U test (healthy/dystrophic) or one-way ANOVA with Sidak’s multiple comparisons test (healthy/dystrophic by muscle)). Boxes: Coefficient of Variation.

