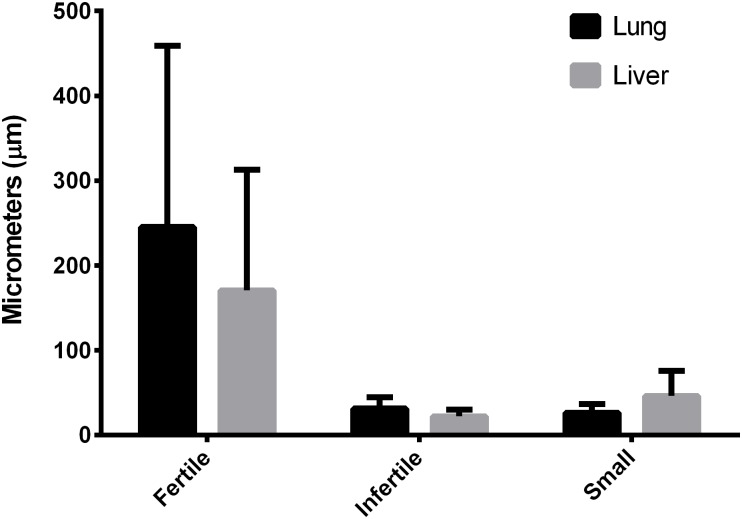
Fig 1. Laminated layer thickness (μm) according to hydatid cyst location and fertility.
Data is shown as mean +/- standard deviation. Fertile, lung: n = 4. Fertile, liver: n = 5. Infertile, lung: n = 83. Infertile, liver: n = 36. Small, lung: n = 10. Small, liver: n = 6. The only statistical differences were between fertile and infertile/small cysts, regardless of organ localization.

