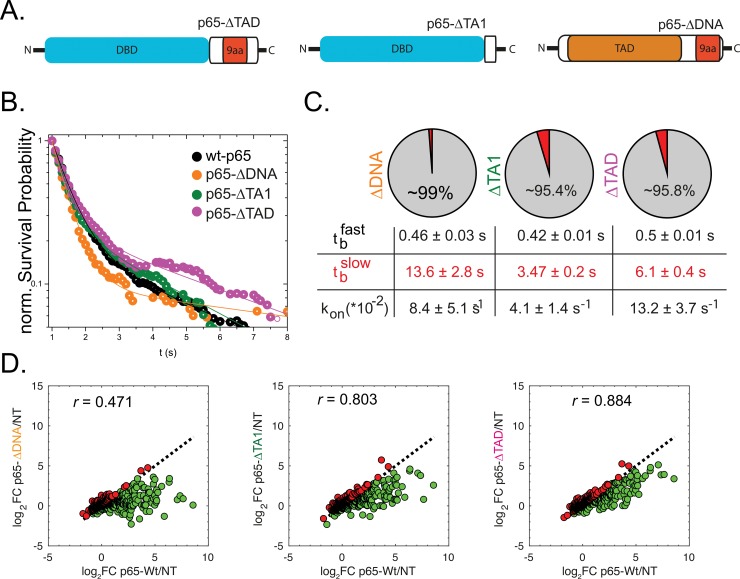
Fig 4. DNA binding and transcriptional activity of p65 truncation mutants.
(A) Schematic overview of p65 truncation mutants. (B) Normalized survival probability (1-CDF plot) plots of the DNA-bound fraction for p65-WT as well as the transactivation mutants ΔTA1 and ΔTAD as well as a mutant with removed DNA-binding domain (ΔDNA). The distributions were fitted using a bi-exponential function revealing the fast (tbfast) and slow (tbslow) DNA binding times. (C) As for the DNA affinity mutants, we found kon* to be in a similar range for all the tested constructs. (D) RNA-Seq analysis revealed very low residual transcriptional activation of p65-ΔDNA as evident by logFC ratio = -0.45. The two transactivation mutants showed good correlation with p65-WT (r ~ 0.8) but at strongly reduced transcript abundance resulting in logFC ratio around -0.25.

