. 2019 Jan 24;12:181–190. doi: 10.2147/DMSO.S189544

Table 5.

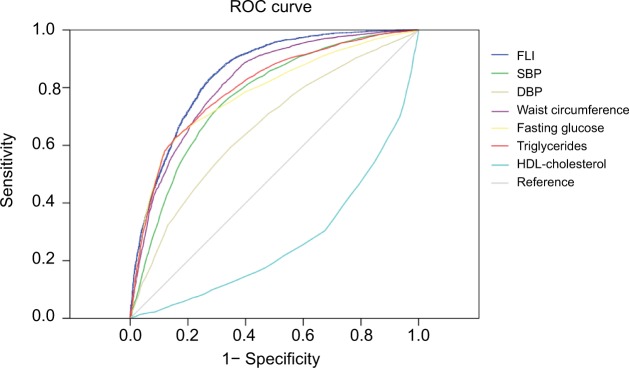
(A) The AUC for the prediction of metabolic syndrome by the FLI and each component of metabolic syndrome; (B, C) selecting the optimal cutoff value of FLI in identifying metabolic syndrome

A
graphic file with name dmso-12-181Fig2.jpg
B
Variable AUC 95% CI P-value
FLI 0.849 0.841–0.857 <0.001
SBP 0.769 0.759–0.778 <0.001
DBP 0.663 0.651–0.674 <0.001
Waist circumference 0.818 0.809–0.826 <0.001
Fasting glucose 0.781 0.771–0.791 <0.001
Triglyceride 0.802 0.792–0.811 <0.001
HDL-cholesterol 0.270 0.259–0.281 <0.001
C
Cutoff AUC (95% CI) Sensitivity 1 – Specificity Positive likelihood ratio Negative likelihood ratio PPV (%) NPV (%)
FLI 0.849 (0.841–0.856)
20 0.828 0.276 3.00 0.24 52.6 91.9
30 0.668 0.171 3.91 0.40 59.1 87.1
60 0.280 0.035 8.00 0.75 74.7 78.4

Abbreviations: AUC, area under the receiver operating characteristic curve; FLI, fatty liver index; HDL, high-density lipoprotein; NPV, negative predictive value; PPV, positive predictive value; ROC, receiver operating characteristic.