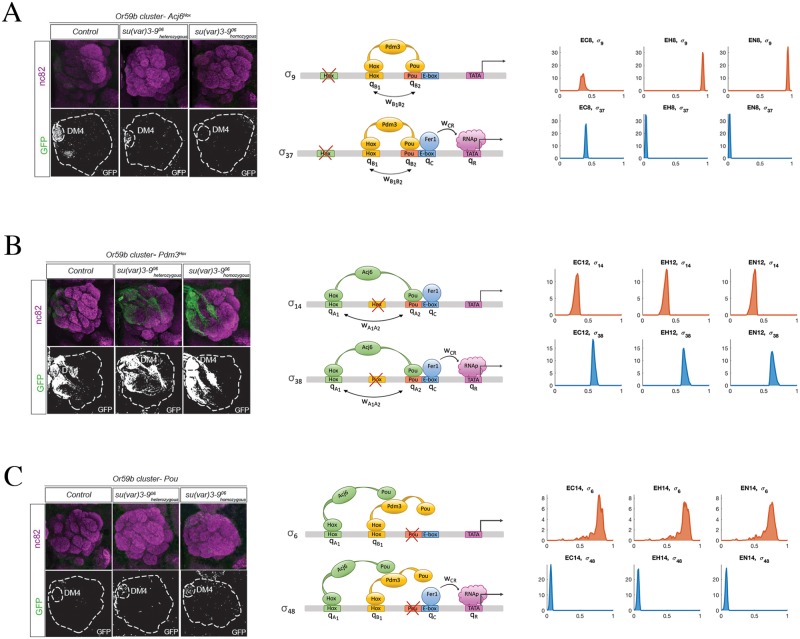
Fig 5. Single binding site mutants and their expression.
(A): Mutation of Acj6Hox (i.e., E8 in Table 1). Left panel: GFP expression decreases passing from normal chromatin state (EC8) to heterozygous su(var)3-9 mutant (EH8) and to homozygous su(var)3-9 mutant (EN8). Middle panel: in our model, the two configuration states that contribute the most in this case are σ9 and σ37. Right panel: the corresponding distributions of P(σ9) (no Or59b expression) and P(σ37) (expression, but very weak) are reported. See Fig. H of S1 Text for all 48 probability histograms. (B): Mutation of Pdm3Hox (i.e., E12 in Table 1). Left panel: GFP expression is very high on all 3 epigenetic conditions (ectopic expression is not considered in the paper). Middle panel: the on-state is σ38 and the main off-state is σ14. Right panel: the on-state has a high probability: P(σ38). See Fig. J of S1 Text for complete histograms of all σk. (C): Mutation of Pou motif (i.e., E14 in Table 1). Left panel: GFP expression increases slightly passing from normal chromatin state (EC14) to heterozygous su(var)3-9 mutant (EH14) and to homozygous su(var)3-9 mutant (EN14). Middle panel: the main on-state is σ48 and the main off-state is σ6. Right panel: the probability of the on-state, i.e. P(σ38) slightly increases passing from EC14 to EH14 and to EN14. See Fig. K of S1 Text for complete histograms of all σk.

