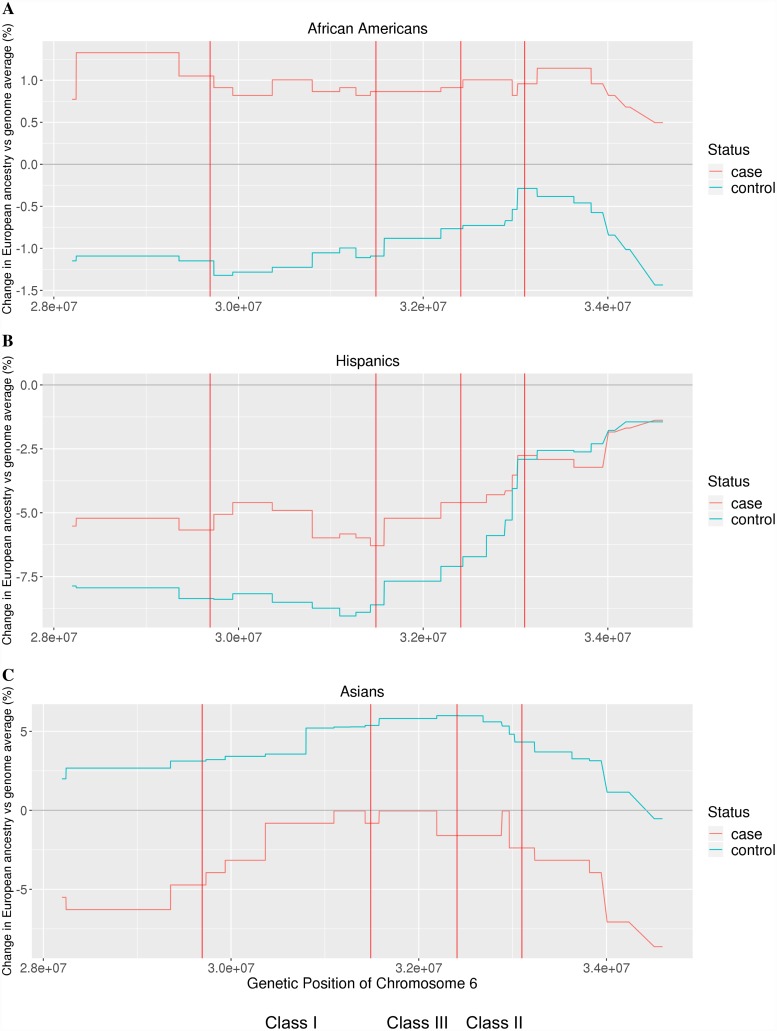
Fig 3. Deviation of local from global European ancestry.
The difference between local and global ancestry at the major histocompatibility complex (MHC) region, plotted for cases and controls. The red vertical bars denote borders of class I, II, and III of the MHC. Local and global ancestries are estimated with RFMix. For both (A) African Americans and (B) Hispanics, cases tended to have higher European ancestry than controls at the MHC. For (C) Asian Americans, cases tended to have lower European ancestry than controls at the MHC.

