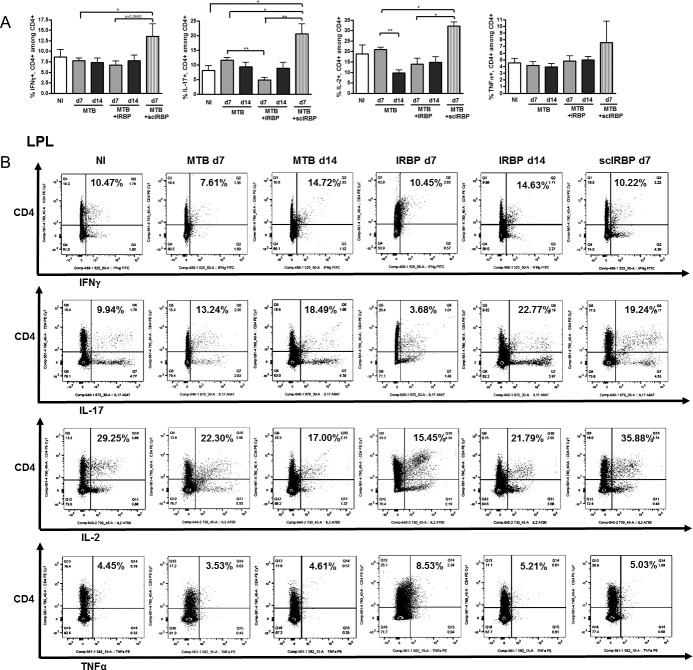
Figure 6.
Cecal and colonic LPL T cell subsets during uveitis. (A) Flow cytometric quantitation of IFNγ-producing, IL-17A–producing, IL-2–producing, and TNFα-producing, CD4+ T cells in the large intestinal LPL in nonimmunized versus MTB-immunized versus IRBP-immunized mice. (B) Representative flow cytometric plots for groups shown in A. *P < 0.05, **P < 0.01; n = 4–6 per group, repeated up to 6 times.

