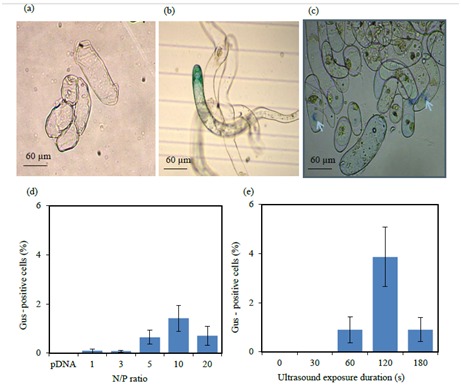
Figure 6.

GUS histochemical assay. (a) Untreated (control) alfalfa cells and (b and c) the alfalfa cells transfected by hPAMAM–DNA complexes. The effects of different N/P ratios (d) and different durations of ultrasound exposure (e) on the efficiency of alfalfa cell transfection by hPAMAM–DNA complexes.
