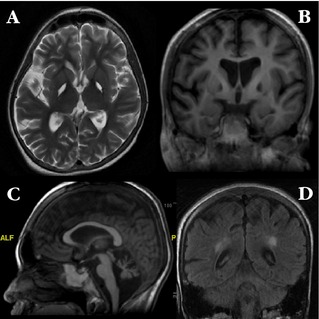
Figure 1.

Axial T2‐weighted brain MRI (A), showing striking hyperintensity in the pallidum bilaterally, with corresponding areas of hypointensity on T1 sequence (B). There is also prominent cerebral (B) and cerebellar atrophy (C) as well as hyperintensity in the posterior periventricular regions bilaterally on T2 FLAIR (D). There were no areas of abnormal signal on gradient‐echo sequence (not shown).
