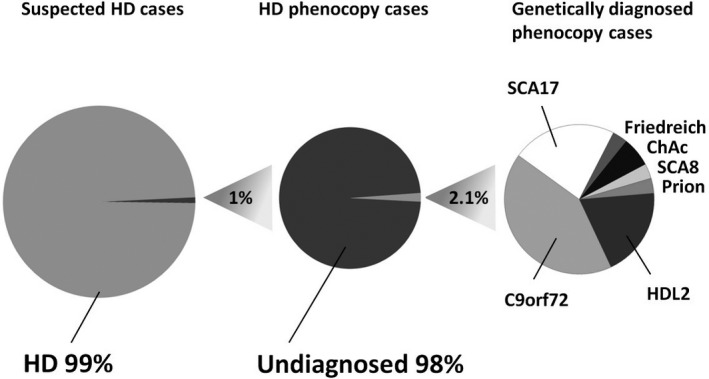
Figure 1.

Relative frequencies of Huntington's disease phenocopies (left), successful genetic diagnosis (middle), and individual phenocopy syndromes (right). Adjusted and updated from Wild and Tabrizi.11 Numbers based on genetic screening studies (see Table 2). Friedreich, Friedreich's ataxia; ChAc, chorea‐acanthocytosis.
