Figure 3.

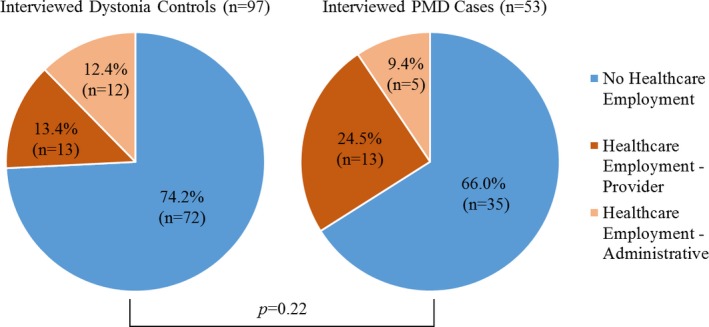
Distribution of healthcare workers, subdivided into provider and administrative roles, and non‐healthcare workers, among interviewed dystonia controls and psychogenic movement disorder (PMD) cases. (χ2 (df = 2, n = 150) = 3.03, P = 0.22).

Distribution of healthcare workers, subdivided into provider and administrative roles, and non‐healthcare workers, among interviewed dystonia controls and psychogenic movement disorder (PMD) cases. (χ2 (df = 2, n = 150) = 3.03, P = 0.22).