
Figure 2.
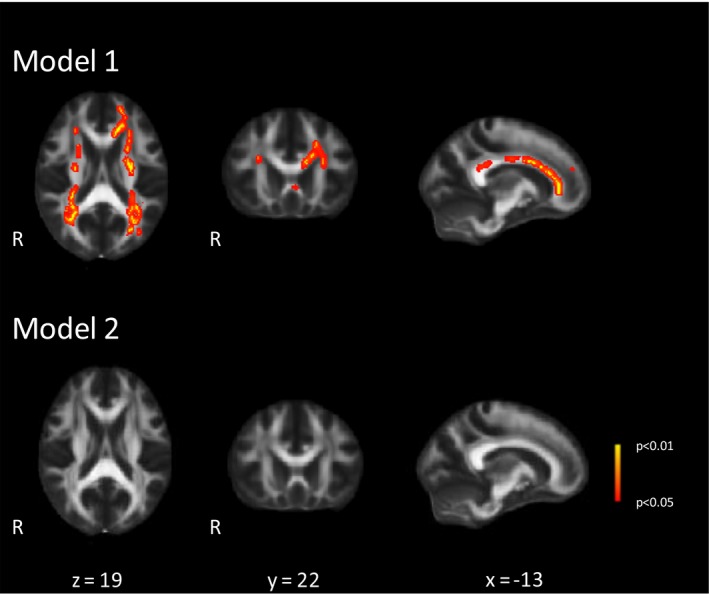
Differences in baseline mean diffusivity (MD) values between participants with and without incident gait impairment. Voxel‐wise analysis of the differences in MD values between participants with incident gait impairment (n = 48) and without gait impairment (n = 240; four participants were additionally excluded because of missing values of microbleeds and DTI artifacts). Adjusted for follow‐up duration, baseline age, sex, height, gait speed, cognitive index and normalized total brain volume (Model 1) and additionally for conventional SVD markers (WMH volume, number of lacunes and microbleeds) (Model 2), performed with a two sample t‐test, thresholded at P < 0.05 and corrected for multiple comparisons. These images are superimposed onto the spatially normalized Montreal Neurological Institute (MNI) stereotactic space FA map. R indicates right side. The x, y, and z coordinates represent the MNI coordinates of each slide.