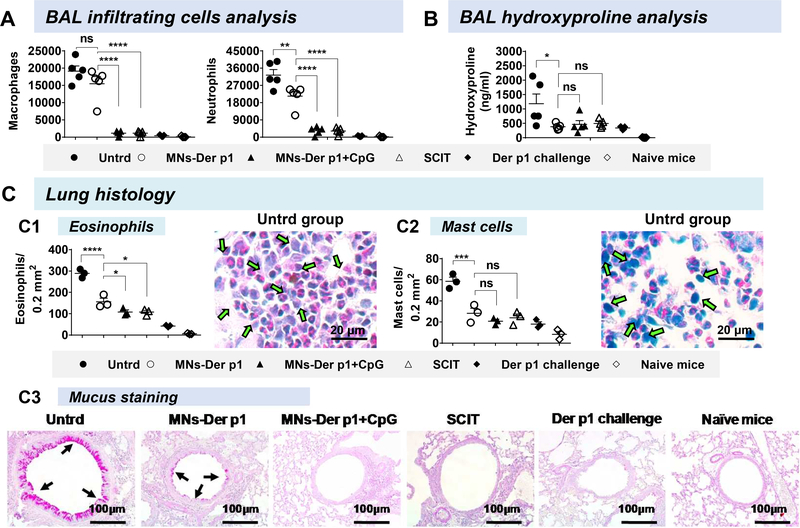
Figure 2. Lung histopathology.
At the end of allergen challenge, BAL fluid and lungs were collected for analysis. (A) Macrophages (CD11b+Gr1−) and neutrophils (CD11b+Gr1+) in BAL fluid were counted as described previously. 9 (B) Hydroxyproline content was analyzed in BAL fluids (Sigma Aldrich, Cat. No. MAK008). Each symbol represents an individual mouse (n=5 mice per group). (C) Lung histology: Multiple sections (7 μm thick) separated by 500 μm were obtained from the top and bottom of the left lung and stained with either hematoxylin and eosin (H&E) for eosinophil analysis or May-Grünwald Giemsa (MGG) stain for mast cell analysis. Each symbol represents average cells from a mouse averaged at 18 independent locations. (C1) Eosinophil cells and (C2) Mast cell. Eosinophil and mast cells for other treatment groups are presented in Supplementary Figure 1 and 2, respectively. (C3) Tissue sections were stained with periodic acid-Schiff (PAS) stain for mucus secretion inside the bronchioles. Bright field micrographs are shown. Arrows point to mucus deposition. One-way ANOVA was used for statistical comparisons between the groups. Bars denote Mean ± SEM. * p ≤ 0.05, ** p ≤ 0.01, *** p ≤ 0.001, **** p ≤ 0.0001, and ns: not significant.

